
Multilevel Modelling
E N D
Presentation Transcript
Multilevel Modelling Dr Andrew Bell, Lecturer in Quantitative Social Sciences
A basic linear regression model Y = B0 + B1*X + e Y e X
What’s the problem? • Assume that the residuals (e) are independent from each other. • Ie that the model has accounted for everything systematic • only white noise remains • This is often simply not realistic
Multilevel structures “once you know hierarchies exist, you see them everywhere” (Kreft and De Leeuw, 1998 p1) Hairs on heads Students nested in schools Voters nested in electoral wards Cows nested in farms Occasions nested in individuals (panel data) Occasions nested in students nested in schools
Multilevel structures “once you know hierarchies exist, you see them everywhere” (Kreft and De Leeuw, 1998 p1) Non-hierarchical structures: Students in both schools and neighbourhoods Students in more than one classroom F1 race results nested in drivers and teams
A basic linear regression model Y = B0 + B1*X + e Y e X
A basic linear regression model Y = B0 + B1*X + e Y e X
A basic multilevel model Y = B0 + B1*X + u + e Y u e X
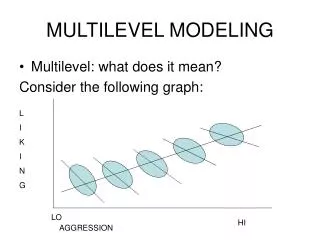
What are we doing? • Modelling complex structures • Modelling heterogeneity • Modelling dependency • Modelling context
Why use MLMs? Toy example Sometimes: single level models can be seriously misleading!
Another example • Reinhart and Rogoff – Growth in a time of debt (2010) • “median growth rates for countries with public debt over roughly 90 percent of GDP are several percent lower.” • Conclusions used by Paul Ryan, David Cameron, etc, to justify austerity policies
Another example • Problems with it (1) • Arbitrary exclusion of countries • A weird weighting system • An excel spreadsheet error that excluded a number of observations alphabetically • Herndon, Ash and Pollin (2013) Does high public debt consistently stifle economic growth? A critique of Reinhart and Rogoff. Cambridge Journal of Economics, online.
Another example Country Year • Problems with it (2) • Assumes a single consistent effect, rather than allowing that effect to vary between countries. • But why should the effect of debt on growth be the same in USA and Britain? • Instead, can use multilevel models to allow for differences across countries
8 6 Australia New Zealand 4 UK 2 US Predicted Growth (%GDP) 0 -2 Japan -4 0 70 140 210 Debt:GDP ratio Another example (and back to 2 levels) Bell, Jones and Johnston (2015) Stylised fact or situated messiness? The diverse effects of increasing national debt on economic growth. Journal of Economic Geography, 15(2), 449-472
Variance Functions • Key aim of multilevel models: model heterogeneity – the variance can vary! • As well as estimating separate effects for higher level entities, we can see how much variance varies • Eg schools matter more (are more varied) for clever students
Final example: F1 racing Team Driver Team-Year Observation
Overall • Why multilevel models are good: • Technically sound: Make realistic assumptions about independent residuals; explicitly model heterogeneity and dependency (rather than ‘correct’ for it) • Substantively interesting: Answer questions you cannot answer with standard modelling techniques • Widely applicable: education, epidemiology, veterinary science, political/electoral science, economics, biology, geography............
Useful resource • CMM LEMMA training courses • https://www.cmm.bris.ac.uk/lemma/ • Online courses from multilple regression (module 3), up to a range of different MLM structures, outcomes, etc • Practical exercises using MLwiN, Stata, R, SPSS • Free, you just need to register
Shameless self promotion • Bell, Andrew, and Kelvyn Jones. 2015. “Explaining Fixed Effects: Random Effects Modelling of Time-Series Cross-Sectional and Panel Data.” Political Science Research and Methods 3(1): 133–53. • Comparison of MLM (or ‘Random Effects’) to Fixed effects modelling; and argues for the benefits of the former • Bell, Andrew, Ron Johnston, and Kelvyn Jones. 2015. “Stylised Fact or Situated Messiness? The Diverse Effects of Increasing Debt on National Economic Growth.” Journal of Economic Geography 15(2): 449–72. • Bell, Andrew, James Smith, Clive Sabel, Kelvyn Jones. 2016. Formula for success: Multilevel modelling of Formula One driver and constructor performance, 1950-2014. Journal of Quantitative Analysis in Sports 12(2): 99-112 Email: andrew.j.d.bell@sheffield.ac.uk Tweet @andrewjdbell