Download
1 / 55
550 likes | 596 Vues
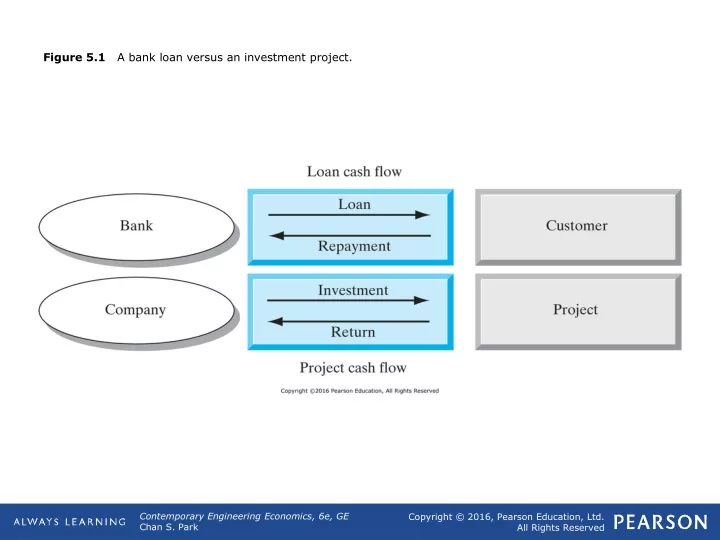
Figure 5.1 A bank loan versus an investment project. Figure 5.2 Cash flow diagram for the computer process-control system described in Example 5.1. Figure 5.3 Illustration of conventional payback period (Example 5.3). Table 5.1 Investment Cash Flows for Two Competing Projects.

E N D
Figure 5.2 Cash flow diagram for the computer process-control system described in Example 5.1.
Figure 5.3 Illustration of conventional payback period (Example 5.3).
Table 5.2 Payback Period Calculation Taking into Account the Cost of Funds (Example 5.3)
Table 5.3 Present-Worth Amounts at Varying Interest Rates (Example 5.5)
Figure 5.5 Present-worth profile described in Example 5.5—the machine tool project is acceptable as long as the firm’s MARR is less than 30%.
Figure 5.6 The concept of an investment pool with the company as a lender and the project as a borrower.
Figure 5.7 Project balance diagram as a function of time. (A negative project balance indicates the amount of investment to be recovered or the degree of risk exposure if the project terminates prematurely.)
Table 5.4 Projected Cash Flows Associated with the Helpmates Project
Figure 5.9 Cash flow diagram for the Helpmate project (Example 5.6).
Figure 5.10 Equivalent present worth of an infinite cash flow series.
Figure 5.11 Net cash flow diagram for Mr. Bracewell’s hydroelectric project (Example 5.8).
Figure 5.12 Diagram illustrating the process of making a choice among mutually exclusive alternatives.
Figure 5.13 Comparing mutually exclusive revenue projects requiring different levels of investment.
Figure 5.14 Analysis period implied in comparing mutually exclusive alternatives.
Table 5.5 Summary of Financial Data for Three Machining Center Design Options
Table 5.6 An Excel Worksheet to Calculate the NPW for Each Option continued on next slide
Table 5.6 (continued) An Excel Worksheet to Calculate the NPW for Each Option continued on next slide
Table 5.6 (continued) An Excel Worksheet to Calculate the NPW for Each Option
Figure 5.15 (a) Cash flow for model A; (b) cash flow for model B; (c) comparison of service projects with unequal lives when the required service period is shorter than the individual project life (Example 5.10).
Figure 5.16 Comparison for service projects with unequal lives when the required service period is longer than the individual project life (Example 5.11).
Figure 5.17 Comparison of revenue projects with unequal lives when the analysis period coincides with the project with the longest life in the mutually exclusive group (Example 5.12). In our example, the analysis period is five years, assuming no cash flow in years 4 and 5 for the lease option.
Figure 5.18 Comparison of projects with unequal lives when the required service period is infinite and the project is likely to be repeatable with the same investment and operations and maintenance costs in all future replacement cycles (Example 5.13).