Maximizing Profits Through Monopoly Strategy
310 likes | 410 Vues
Learn to maximize profits in a monopolistic market by setting optimal prices and quantities. Explore demand, revenue, cost, and profit functions to achieve your financial goals.

Maximizing Profits Through Monopoly Strategy
E N D
Presentation Transcript
Project 1: Marketing An Introduction
Goal Your goal is three-fold: • To find the price of a particular product that will maximize profits. • Determine the number of units that will be sold at the optimal price. • Determine the maximum profit that is expected from the sales of your particular product.
Definitions • Market: A market is people or organizations with purchasing power and willingness and authority to buy • Product: Good or service bought and sold
Marketing/Marketing Research • Product differentiation is very important in marketing • “What makes this any different from product X?” • Market can be segmented by age, culture, and interest. • http://www.ama.org
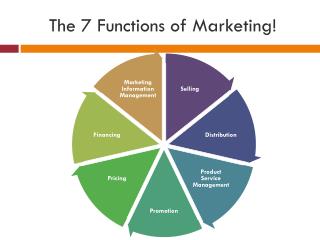
Marketing Mix -- Components • Product Planning • Distribution • Promotion – Advertisements • Pricing • This is what we are interested in
Competition • Monopoly: Amount of product depends on price set. • There are few perfect (pure) monopolies – usually occur in government regulated services such as gas and electric • Sometimes the above examples are called natural monopolies
Competition • Perfect Competitor: Amount sold does not affect the good’s price • Example (from text): Small farmer planting wheat or soybeans. Shifting to either affects neither price at all.
Where do we fit? • Our company has temporary monopoly power for our product. • This means that we have a new product that does not have an exact competitor
The functions • To achieve the goal of the project, we will need to look at different mathematical functions • Recall: What is the definition of a function? • We have 4 in particular that we will need to study • Demand, Cost, Revenue, and Profit • Note the units on each of the axes for all of the functions • Note: We are assuming that we are looking at a monopolistic situation
Demand Function, D(q) • Gives the unit price, D(q), at which a company can charge in relation to the total quantity (q) of the product that it sells at that price • Demand curve, which is the graph of D(q), is generally downward sloping • Why?
Demand Curve • Recall: What does it mean for a curve to be downward sloping? • As quantity goes down, what happens to price? • As quantity goes up, what happens to price? • What should our curve look like?
Demand Curve • We can look at the curve and see at what unit price we can sell a specified number of items • When the unit price is high, the total quantity we sell is low • When the unit price is low, the total quantity we sell is high • For our purposes we are going to assume that the maximum quantity that can be sold is where the curve intersects the q-axis. Demand Curve, D(q) Unit price, D(q) (in $) Total quantity (q)
Perfect Competitor vs. Monopoly • For a perfect competitor, if you plot price against quantity sold you get a constant function. Why? • What will the two curves look like plotted against each other? Demand Curve, D(q) Monopolist Unit price, D(q) (in $) Perfect Competitor Quantity (q)
Revenue Function, R(q) • To determine the total revenue you will receive from selling a product, you multiply the total number of goods sold by the unit price of the goods • R(q)=D(q)*q • Now, if you sell a small amount for a high price, you will have a small revenue • If you sell a large amount for a low price, you will have a small revenue • What does the curve look like?
Revenue Curve • We can look at the total revenue that is produced when a specified number of items is sold • Our graph, starts out low, gets high, and then goes low again Revenue Curve, R(q) Total Revenue (in $) Quantity (q)
Cost Function, C(q) • When you are making goods, you will incur costs • There are two types: • Fixed Costs: Incurred even if units are not produced • Variable Costs: Unit-based production • Examples: labor, lighting, etc. • What does the curve look like?
Cost Curve • We can look at the total costs that are incurred when a particular number of goods are produced • The more goods that are produced, the higher the total cost Cost Curve, C(q) Total cost (in $) Quantity (q)
Profit Function, P(q) • When does a company make a profit? • When the revenue exceeds the costs • Thus, the profit function is total revenue minus total cost or P(q) = R(q) – C(q). • When the difference is positive, the company has made a profit • When the difference is negative, the company has lost money • What does the curve look like?
Profit Curve • When a small number of units are produced, the total cost will be more than the total revenue • Hence, you will have a negative difference • As the number of units produced is increased, the total cost starts to reach the total revenue • It eventually reaches it (break-even point) and then exceeds it, reaching a maximum point • After the maximum point is reached it can only decrease • This means that if you start making more and more units, your costs exceed your revenue again – hence a negative difference
Profit Curve • How does this translate to a graph? Profit Curve, P(q) Total profit (in $) Quantity (q)
Class Project: Save-it-All! • Save-it-All! developed and patented a new type of computer drive, SXL • Features reliability, compact size, and the ability to store 500 MB of information • Under the conditions of the patent, Save-it-All! has the exclusive right to produce and market the new technology during the next three years, giving them temporary monopolistic power*. * This will be an assumption for our project
Questions to Answer • How should they price SXL such that it will produce a maximum profit during the coming year? • How many drives can they expect to sell? • How much profit might they realize from sales?
Research • Save-it-All!’s marketing department did research on potential buyers • Estimates that there are 120 million potential customers in the national market during the coming year • Studied 6 test markets to determine the fraction of the potential buyers who would actually buy SXL at various price levels • Assumption: From past experience, they will assume that SXL will have a quadratic demand function
Information • In Marketing Data.xls, you have the results from the test markets • You also know the costs of production • Fixed overhead costs of $21,600,000 during coming year • Variable costs: • First 500,000 drives -- $115 per drive • Next 600,000 drives -- $100 per drive • Rest of the drives -- $90 per drive
Pricing & Production • Using the information that is given, Save-it-All! wants to analyze the pricing and production of the product, SXL • They want to know a price in order for them to achieve maximum profit • They want to know how many they will sell at the optimal price • They want to know the maximum profit expected • They want to know how sensitive the profit is to changes in optimal quantity • They want to know what the consumer surplus will be if the profit is maximized
Advertising and Capital • Additionally, Save-it-All! wants to know the following: • What profit can they expect if the unit price of the drive is $154.49? • How much should they pay for advertising if the campaign increases demand for the drives by 10% at all price levels? • How would the 10% increase in demand effect the optimal price? • Would it be smart if they put $4m into training and streamlining if it reduces the variable production costs by 7% for the coming year?
Your project • Go on-line and get the team data (in an Excel file) • It contains test market data and production cost estimates • Also, it has 9 questions that will need to be answered at the end of the project • Assume that your company has temporary monopolistic power for the next 3 years
Preliminary Report • We will follow the course syllabus • Everyone will go on the same day – order of presentation will be random • Casual dress (no shorts, wrinkled shirts, low cut or short shirts/skirts, flip-flops) • Each team will present for about 5-10 minutes • Bring a hard copy of your slides for me (handout – 4 slides per page) • Be prepared for computer mishaps – have backup or hard copy of slides
Preliminary Report • Introduce your company and your job descriptions (your choice – be creative) • Come up with a unique product that makes sense with the prices given • Remember product differentiation • Know basic terms and assumptions • Do not give list of definitions but work into presentation • Present the data • Give an initial guess for the max profit • How?
Initial guess of max profit • For each test market, you should calculate the following: • This calculation gives you the number of units in the potential national market • Multiply that number by the price for that test market • This gives you the total revenue for each particular test market
Initial guess of max profit • Now, you will need to know the total cost for each test market • You already know the fixed cost • Determine the variable cost for each amount of units (you have 8) by using the variable cost information given • Total cost = Fixed Cost + Variable Cost • Once you have the total cost for each test market, subtract it from the total revenue from that test market. • The greatest number will be your initial guess