Download
1 / 46
460 likes | 671 Vues
Parameterization of EUSES Chemical Fate Model for Israel: EUSES-IL . Ella Cohen-Hilaleh Mary Kloc June 2010. Project Outlines. Introduction Model description – EUSES. Data collection. Findings – test case, sensitivity analysis . Conclusion. Project outlines.

E N D
Parameterization of EUSES Chemical Fate Model for Israel: EUSES-IL Ella Cohen-Hilaleh Mary Kloc June 2010
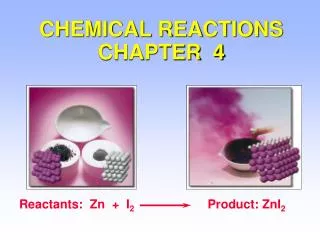
Project Outlines • Introduction • Model description – EUSES. • Data collection. • Findings – test case, sensitivity analysis. • Conclusion.
Project outlines • Pollution of natural resources is a main concern of the developing world. • Pollution sources: Natural sources – fire, oil leak, saline springs… Man-made sources – industrial spills, agricultural fertilizers and pesticides, domestic sewage, transportation emissions… Prediction of pollutant concentration in the environment is required.
Project outlines EUSES – a European model for steady state pollutant distribution. • Purpose: Adjusting EUSES model to Israel for interface with Eco–Indicator. • Method: Wide data collection, reprogramming of EUSES, test sample by comparison with local data of spills and residues monitoring, sensitivity analysis.
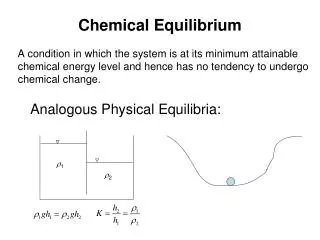
Introduction to Mass Balance Models This represents one environmental compartment (either air, water, soil, etc.) at one spatial location.
Introduction to Mass Balance Models Chemical, such as a pesticide, is emitted into the compartment at a certain rate.
Introduction to Mass Balance Models Chemical can move between different environmental compartments (e.g., from water to soil)
Introduction to Mass Balance Models Chemical can move between different environmental compartments (e.g., from water to soil) and between different spatial compartments.
Introduction to Mass Balance Models Chemical can also be formed and degraded through reactions.
Introduction to Mass Balance Models flow in flow out Mass flow for the single compartment:
Introduction to Mass Balance Models flow in flow out Mass flow for the single compartment: 0= Steady state approximation
Relevant Output Concentration in the compartment: • Residence Time: • the average time the chemical spends in the box
SimpleBox 2.0 3 nested spatial scales, each with a set of environmental compartments:
Example from SimpleBox model Emitted into soil only
Example from SimpleBox model Moves between environmental compartments at various rates
Example from SimpleBox model Moves between spatial compartments at various rates
Example from SimpleBox model Degrades through reaction
Example from SimpleBox model Most of the chemical remains in the soil compartment.
Parameterization for Israel unchanged Israel Element from our partition
Input data to the model – • Demographic data • Geophysical data • Chemical data Sources: • Direct from literature – Scientific & Governmental sources. • Indirect - Estimations. Will see some main informative figures..
CBS’ division of Israel -Districts, Sub-Districts and Natural Regimes, 20081
CBS’ division of Israel -Districts, Sub-Districts and Natural Regimes, 20081 Population density - Israel 20081
CBS’ division of Israel -Districts, Sub-Districts and Natural Regimes, 20081 Land use distribution in Israelby district2 Population density - Israel 20081 Israel – 22,000 sk.km Hifa – 860 sk.km North – 4600 sk.km Jerusalem – 650 sk.km Tel Aviv – 170 sk.km Center – 1300 sk.km South - 14400 sk.km
Drainage basins of Israel4,5 Yearly rain average map (1990-1961)6
Drainage basins of Israel4,5 Dan - 190 Snir (hazbany)- 45 Hermon (Banyas) - 70 Bezet – 0.15 Einan - 0 Dishon - 0 Cziv - 0.6 Gaaton - 0 Amud – 1.5 Zalmon – 0.5 Naaman - 15 Yavniel - 1 Zipory - 2 Southern Yarden - 20 Kishon – 0.5 Taninim - 25 Tavor - 1 Hadera - 0 Alexander - 0.5 Harodb - 6 Yarkon – 3.5 Sorek – 0.5 Yearly rain average map (1990-1961)6 Stream flow (MCM) 3
Soil map of Israel7 Runoff determination11 Rational Equation Q=ciA Q = Peak discharge [L3 /T]c = Rational method runoff coefficienti = Rainfall intensity [L/T]A = Drainage area, [L2 [ • Runoff coefficients were estimated according to: • Soil type • Land use
Soil erosion degree8 Conversion via bulk density: Sandy soils – 1.2-1.8 g/cm3 Fine-textured soils– 1-1.6 g/cm3 Assuming bulk density of 1.4 g/cm3
Soil erosion degree8 Conversion via bulk density: Sandy soils – 1.2-1.8 g/cm3 Fine-textured soils– 1-1.6 g/cm3 Assuming bulk density of 1.4 g/cm3.
Water table12 Coastal aquifer Large variation over time – so minimum water tables were taken: Yarkon-Taninimaquifer Western Galilee
Test sample – Pesticides in Lake Kinneret Comparison of EUSES-IL prediction to measured concentration in the main water compartment. Input: Estimated amounts that are released to the environment each year, from documented purchase-lists.
Test sample – Pesticides in Lake Kinneret Comparison of EUSES-IL prediction to measured concentration in the main water compartment. Input: Estimated amounts that are released to the environment each year, from documented purchase-lists. Pesticide use comparison for 1996, 1997 and The Agricultural Extension Service recommendations (SHAHAM) between different crops13: No significant differences between crops, years and professional recommendations.
Pesticides bought in 1997 4.44 0.93 0.03
Endosulfan Atrazine Diazinon Tested chemicals
Monitoring data - Pesticide residue concentration (ppb) in lake Kinneret water14
Results of Testing Endosulfan Atrazine Diazinon
Comparison with EUSES and measured values Endosulfan Atrazine Diazinon 4.44 ton/year 0.03 ton/year 0.93 ton/year
Area Fraction Agricultural Soil Sea Area River Flow Rain Rate Wind speed Temperature • Our model is more dependent on geographical information than EUSES. • We divide the regions using mostly geographical data • We also consider the geographical locations of different soil types, • water types, etc., within each region. • Geographical parameters are not distributed throughout large regions • as in EUSES, but are very region-specific. • Most other non-geographical parameters had similar sensitivities between models. • Except wind speed (?)
Chemical properties of tested chemicals Atrazine Endosulfan Diazinon
Atrazine Chemical properties of tested chemicals Endosulfan Diazinon
Conclusion • EUSES-IL is a significantly improved model compared to EUSES. • Possible future improvements: • Incorporate more accurate chemical equations into the model. • More specific information is required for optimizing results (chemical use, geophysical data). • Find more measured data for testing and optimizing the model.
References • Central Bureau of Statistics - Statistical Abstract of Israel 2008 - No.59. 2. Statistical Abstract of Israel 2009-No.60, Table 1.2. 3. Perlmutter M. Springs and streams in Israel 2008 - report of the SPNI (1), according to Hydrological Service data. 4. Israel Hydrological service. 5. Website of Moto Track: http://www.mototracks.co.il/thematics.htm 6. Gvirtzman, H. 2002. Israel Water Resources, Chapters in Hydrology and Environmental Sciences, Yad Ben-Zvi Press, Jerusalem, 301 p. 7. Ministry of Agriculture – Agricultural research organization & soil conservation and drainage department - 1975. 8. Soil Survey, Ministry of Agriculture, Soil Conservation unit, 1954 9. Kosmasa C et al. The effect of land use on runoff and soil erosion rates under Mediterranean conditions(1997) Catena, 29 (1), pp. 45-59. 10. Laronne J., Lekach J., Cohen H., Alexandrov Y.Experimental Drainage Basins in Israel: Rainfall, Runoff, Suspended Sediment and Bedload Monitoring American Geophysical Union, Fall Meeting 2002, abstract #H51B-0824. 11. Website of Mountain Empire Community College – Big Stone Gap, Virginia:http://water.me.vccs.edu/courses/CIV246/table2_print.htm 12. Hydrological Representative Date - February 2010, Israel Water Authority, Israel Hydrological Service: elyon1.court.gov.il/heb/mayim/Hodaot/hs_01.pdf 13. Bar-Ilan I., Melman G. Survey of pesticides use in the Northern drainage basin of Lake Kinneret (1998) MIGAL - Galilee Technology Center. Kiryat-Shmona, Israel. 14. Zohary T. et al. Kinneret research and monitoring – lab work report for 2008 (T 9/2009) ) Kinneret Limnonological Laboratory, Israel Oceanographic and Limnological Research. 15. Kawamoto K, MacLeod M, Mackay D. Evaluation and comparison of multimedia mass balance models of chemical fate: application of EUSES and ChemCAN to 68 chemicals in Japan. Chemosphere 44 (2001) 599-612. 16. Brandes LJ, den Hollander H, van de Meant D. SimpleBox 2.0: a nested multimedia fate model for evaluating the environmental fate of chemicals. RIVM report no. 719101029, Netherlands.