Download
1 / 11
110 likes | 233 Vues
Guide to the Student Growth Percentile District & School Reports. Office of Educational Accountability April 2013. Individual Student Growth Percentile. Measures the academic progress each student has made in a year

E N D
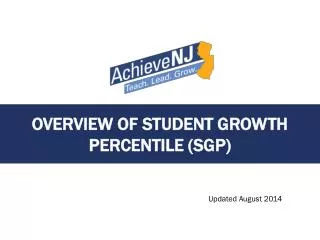
Guide to the Student Growth Percentile District & School Reports Office of Educational Accountability April 2013
Individual Student Growth Percentile • Measures the academic progress each student has made in a year • Students with two consecutive years of test scores are provided with a growth percentile • A student is compared to their “academic peers” or students with similar score histories • A student growth percentile of 60 means that the student “grew” as much or more than 60% of students with similar test score histories
Median Student Growth Percentile • calculated by aggregating all of the individual student growth percentiles from the group and identifying the median (or middle) number • a representation of “typical” growth for students in the group.
Accessing the Reports Select “Growth” from the drop-down menu
Related Dashboards and Filters You can narrow your report using various filters! Related dashboards – to quickly display SGP data by grade level, gender, race/ethnicity, and so forth.
Interpreting a Report Percent proficient or advanced on WKCE Click here to show data details or to export your chart These fifth graders are at 31.8% proficient or advanced and the 43rd growth percentile – authorized users can click on the bubble to view the student level data behind this data. Median growth percentile Student group (here, grade levels)
Individual Student Growth Percentile Roster Click on the student icon to view the individual SGP report
Guided Analysis Choose “Guided Analysis” from the “Related Dashboards” menu for an interactive guide to interpreting your growth reports
Thank You! Questions may be sent to OEAmail@dpi.wi.gov