Download
1 / 19
190 likes | 357 Vues
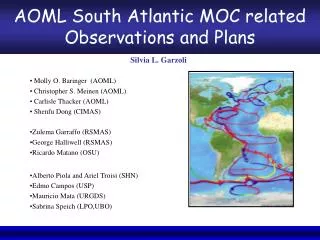
AOML South Atlantic MOC related Observations and Plans. Silvia L. Garzoli. Molly O. Baringer (AOML) Christopher S. Meinen (AOML) Carlisle Thacker (AOML) Shenfu Dong (CIMAS) Zulema Garraffo (RSMAS) George Halliwell (RSMAS) Ricardo Matano (OSU) Alberto Piola and Ariel Troisi (SHN)

E N D
AOML South Atlantic MOC related Observations and Plans Silvia L. Garzoli • Molly O. Baringer (AOML) • Christopher S. Meinen (AOML) • Carlisle Thacker (AOML) • Shenfu Dong (CIMAS) • Zulema Garraffo (RSMAS) • George Halliwell (RSMAS) • Ricardo Matano (OSU) • Alberto Piola and Ariel Troisi (SHN) • Edmo Campos (USP) • Mauricio Mata (URGDS) • Sabrina Speich (LPO,UBO)
Heat transport across 35°S SAM: Moorings at 35°S Model data experiments Outline
SAMOC Workshop, Estancia San Ceferino, Buenos Aires Argentina, May 8, 9, and 10, 2007 Map of the South Atlantic and Southern Ocean, including the two principal choke point regions, the Drake Passage and south of South Africa, with the current and proposed locations of instrument deployments and the institutes leading the corresponding associated projects.
AOML High density XBT AX18 line Correlation of MOC and heat transport across 33°S (C.I.=0.2) High density XBT 20 lines conducted by AOML since July 2002 (Barreiro, 2007)
Mean surface circulation in the region (Goni et al., 2008) (Lumpkin and Garzoli, 2008)
Heat Transport Methodology (Baringer and Garzoli, 2007) • XBT data is collected using Sippican T-7 probes typically to depths of about 800 meters • Data is extended to the ocean bottom using Levitus 0.25° data set. • Salinity is estimated for each XBT profile by using S (T, P, Lat, Long) derived from Argo and CTD data (Thacker 2006). • Meridional Ekman transports are computed as the Ekman mass (My) and Ekman heat (Hy) transport using NCEP daily reanalysis winds and interpolating the daily NCEP values to the time and location of the XBT observation.
Mean Heat transport (14 realizations CT-BA) = 0.53 PW Std = ±0.11 PW (Garzoli and Baringer, 2007) Mean Heat transport (3 transect CT-R) = 0.54 PW Std= ± 0.10 PW. Mean Heat transport (20 realizations) = 0.53 PW Std = ± 0.12 PW Total, Ekman and Geostrophic components of the Heat transport across the AX18 lines.
Time series of the Ekman Heat transport integrated across the basin as a function of latitude. Dots indicate mean latitude of each cruise.
Annual cycle of the Ekman component, geostrophic component, and total heat transport across the AX18 20 realizations. Results from the 3 lines occupied from Cape Town to Rio are shown in a different color (yellow).
Meridional heat flux – model comparisons 0.53 ±0.11 PW (Garzoli and Baringer, 2007) (Piola, 2007) Comparison with other results
Observing the DWBC One of the largest uncertainties in the measured heat transport is the lack of direct measurements of the barotropic component of the flow, which is largest to the west of 47°W. This is particularly important because at the western boundary the Malvinas Current and the DWBC both flow in the same direction, creating a strong barotropic flow whose magnitude and variability are poorly known. Mean model velocities at 1500 m depth Model sections of the meridional velocity showing the DWBC at 30°S (left) and 34.5°S (right). Negative velocities indicate southward flow. (From POCM model, Tokmakian and Challenor, 1999).
- 32 - 33 - 34 - 35 13 14 15 16 17 18 19 SAM In conjunction with the CPIES deployed by Sabrina Speich (Fr) Positions of the first stations of the BONUS-GOODHOPE transect. In green the two stations where the two C-PIES moorings have been deployed. Proposed cruise track and tentative instrument locations for the new IES line in the South Atlantic. This program will be conducted in collaboration with scientists from Argentina and Brazil.
Can we do it? A combination of CTD with IES (using the GEM technique) and pressure gauges proved to be an adequate mean to monitor the transport of the Deep Western Boundary current in the North Atlantic across 26.5°N . Comparison of the DWBC transport at 26.5°N estimated from three different techniques. All transports are integrated between 1200 and 4800 dbar. The same bottom pressure gauge data is used to provide the bottom absolute velocity reference for both the IES and the Dynamic height moorings. Note that the magenta and green lines switch to dotted in late January when the top of one mooring broke off and the remaining segment of the mooring slumped down due to the loss of buoyancy; current meter and dynamic height mooring data after this point should be viewed as having larger error bars. (Meinen et al., 2004)
Pop up system SAM first cruise October 08Deployed 4-5 yearsBiannual visits to recover the data
AMOC variability in the South Atlantic Data analysis and a numerical model simulation • Characterize the mean and time varying pathways of the AMOC • Evaluate the correlation between the AMOC strength and the meridional Heat Transport. • Defining the importance of variations in inter-ocean and inter-basin exchange and the connectivity of the MOC. AX22 1996 to present AX18 2002 to present AX25 2004 to present Comparison transports from XBT and altimeter
Global 1/12º HYCOM Climatological simulation. Produced at NRL (J.Metzger, J. Shriver, A. Wallcraft, E. Chassignet, H. Hurlburt). ECMWF ERA40 forcing plus 6 hourly wind anomalies from a repeat year of NOGAPS winds. • A South and Tropical Atlantic regional model will be nested inside the Global model. In this way better accuracy can be achieved for: • Trajectories of numerical drifters and floats • Transports and diapycnal flux diagnostics. daily boundary conditions from the global model Global SSH in the Regional model domain (From Garraffo,2008)
Subsurface flow (mean model year 15, ~100m) NBC EU TG BC STG MC WG Particles will be launched in the regional model, in a 1x1 regular grid at several depths, following the model 3-D motion, plus at 0.25 deg in transects near the inflow into the domain and selected locations (yellowrectangles) e.g., DWBC, NADW. Deep flow (mean of model year 15, ~3000m) AC (From Garraffo, 2008)
"Observing System Simulation Experiments for the AMOC” Carlisle Thacker (NOAA/AOML), George Halliwell (RSMAS/UM) • Objective: • To estimate the effectiveness of strategies for monitoring the overturning circulation. • Technique: • Simulate observations and then evaluate how uncertainties associated with the overturning circulation are reduced when they are assimilated into an ocean model. • As accurate quantitative characterization of model errors and their correlations and of the noise characteristics of the simulated data strongly influence the results of an OSSE, these issues will receive considerable attention. • Methodology: • The system will be calibrated by simulating data similar to those from the RAPID/MOCHA program and seeing whether they have an impact similar to the real data. • The impact of similar data from other sections, e.g. near 30S, will be evaluated. • Once the system is working, the value of other types of observations can also be considered, e.g., extending the depth range of Argo profiling floats.