Economic Development : Overview -2-
200 likes | 309 Vues
Explore the intricate dynamics of income distribution, human development, and economic growth within developing countries. Delve into the disparities between the wealthiest and poorest segments, and how these affect overall development indicators and quality of life.

Economic Development : Overview -2-
E N D
Presentation Transcript
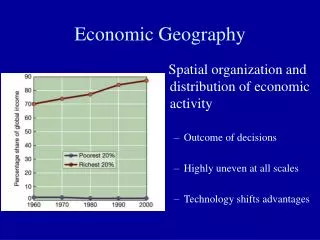
IncomeDistribution in DevelopingCountries -1- • Enormous wealth coexisting with great poverty within developing countries, • Poorest 40% of the population earn, on average, around 15% of overall income, whereas the richest 20% earn around half of total income, • Intra-country vs. inter-country disparities, • The poor are twice cursed: (1) living in countries that are poor on average, (2) receiving end of the high levels of inequality in those countries
IncomeDistribution in DevelopingCountries -2- • Tendencyfortheshare of therichest 20% tofall as wecrossthe $8,000 p c incomethreshold, • Alsothereexists a tendencyfortheshare of richest 20% toriseearly on in incomescale, • Theshare of poorest 40% at bothextremes of theincomescales is relativelyhigh, andfallsto a minimum in themiddle • Conclusion: Inequalitymightriseandthenfall as wemovefromlowertohigherincomelevels (rememberKuznet’sinverted U hyppothesis).
EconomicDevelopmentProcess • At verylowlevels of income, averagelevels of livingareverylow, andso it is difficulttosqueezetheincomeshare of thepoorest 40% below a certain minimum. Share of therichest 20%, on theotherhandarehigh, but not as extraordinarilyhigh as in middleincomecountries, • Richestgroup in thesociety, morethanproportionatelybenefitfromdevelopmentprocess, andshare of poortendtofall (not in absoluteterms), • At higherlevels of p c income, economicgainstendto be distributedmoreequally.
HumanDevelopment • GNP p c : A reliable indicator of development? • Indicators of Development: • Literacy, Access to Drinking Water, Low Rates of Infant Mortality, Life Expectancy, etc. • A high GNP p c with poor indicators of Development: HOW? • Income Inequality
HumanDevelopmentIndex • Puts various socio-economşc indicators together, • Three components: (1) Life expectancy at birth: indirectly reflects infant mortality, (2) Educational attainment of the society: 2/3 weighted average of adult literacy + 1/3 weighted combination of enrollment rates in primary, secondary and tertiary education, (3) P c income, adjusted after a threshold.
Turkey’s HDI 2006 andUnderlyingIndicatorsInComparisonwithSelectedCountries
InternationalComparison • HDI of Industrial Countries = 0.916, • HDI of Developing Countries = 0.570, • HDI of Industrial Countries are 1.6 times higher than Developing Countries, eventhough their Real GDP p c (PPP$) is 6 times higher! => Mean Anything?? => Ranking
Income P C & HumanDevelopment • GDP still acts as a fairly good proxy for most aspects of development. • Argument: Rising income levels ultimately translate into beter health, nutritional, and educational standards in a population. • Explanatory Power of p c GDP has over other basic indicators => Correlations among GDP pc and indicators of Human Development.
Averageyears of Schooling vs. GDP p c forDevelopingCountries
StructuralFeatures • Demographic Characteristics • Occupational and Production Structure • Rapid Rural – Urban Migration • International Trade
DemographicCharacteristics • Poor Countries are characterised with high birth / death rates. • As development proceeds, death rates decrease, often birth rates remain high => Gap opens between birth and death rates => High population growth * Negative Population Effect vs. Positive Population Effect