Download
1 / 24
240 likes | 389 Vues
Science on a Sphere Evaluation at the Science Museum of Minnesota. Kirsten Ellenbogen, Ph.D., Director of Evaluation and Research in Learning Amy Grack Nelson, Evaluation and Research Associate. SMM Science on a Sphere Evaluation. Science-on-a-Sphere Base-line Study

E N D
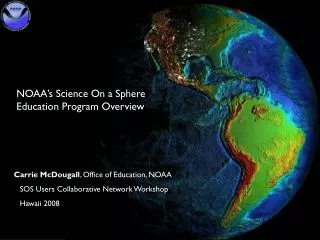
Science on a Sphere Evaluationat the Science Museum of Minnesota Kirsten Ellenbogen, Ph.D., Director of Evaluation and Research in Learning Amy Grack Nelson, Evaluation and Research Associate
SMM Science on a Sphere Evaluation Science-on-a-Sphere Base-line Study In winter 2006, SMM carried out a base-line study using four narrated NOAA visualizations. Timing data were gathered and visitors were interviewed to gauge their reactions to SOS, understand their comprehension of SOS, and gather comments about potential future enhancements.
SMM Science on a Sphere Evaluation Science-on-a-Sphere Base-line Study Time Spent at Science on a Sphere (n=81) Median Time Minimum TimeMaximum Time 3 min. 16 sec. 14 min., 4 sec. Viewing Behavior (n=81) 37% Stood in one place or circled less than half of the Sphere 63% Circled more than half of the Sphere
SMM Science on a Sphere Evaluation Science-on-a-Sphere Formative Study In spring 2006, SMM carried out an evaluation of SOS at its new location with new visualizations. Again, Timing data were gathered and visitors were interviewed to gauge their reactions to SOS, understand their comprehension of SOS, and gather comments about potential future enhancements.
SMM Science on a Sphere Evaluation Science-on-a-Sphere Formative Study Time spent at SOS during base-line study (n=81): Median TimeMinimum TimeMaximum Time 3 min. 16 sec. 14 min., 4 sec. Time spent at SOS during formative study (n=50): Median TimeMinimum TimeMaximum Time 3 min., 29 sec. 30 sec. 30 min., 17 sec.
SMM Science on a Sphere Evaluation Science-on-a-Sphere Formative Study Total time at SOS (n=50): Median Time Minimum TimeMaximum Time Sat down (n=30) 5 min., 54 sec. 51 sec. 30 min., 17 sec. Didn’t sit (n=20) 2 min., 12 sec. 30 sec. 7 min., 30 sec.
SMM Science on a Sphere Evaluation Science-on-a-Sphere Formative Study Table 1: Behaviors viewed at SOS (n= 50) BehaviorPercent of Visitors Read label 82% Talked about content on SOS 72% Pointed at SOS 62% Sat down 60% Read label out loud 24% Talked about technology of SOS 22% Pointed to label 20%
SMM Science on a Sphere Evaluation Science-on-a-Sphere Formative Study How Visitors Viewed the Sphere (n=50): Percent of Visitors Stood in one place 26% Circled less than half 26% Circled half or more 12% Circled entire exhibit 36%
SMM Science on a Sphere Evaluation Science-on-a-Sphere Formative Study Interest in Science-on-a-Sphere (n=50): Percent of Visitors I was so interested I’d come see it again. 72% I was interested, but I wouldn’t come see it again. 22% I wasn’t really interested. 6% I didn’t find this interesting at all. 0%
SMM Science on a Sphere Evaluation Footprints Tracking Study Footprints (16 min.) was set up to run continuously. Visitors were unobtrusively observed when they entered the exhibit area to understand their viewing behaviors and how long they watched the film. Observations took place December 26, 2006 to January 7, 2007.
SMM Science on a Sphere Evaluation Footprints Tracking Report (n=73): Median Time Minimum TimeMaximum Time Sat down (n=34) 6 min., 37 sec. 30 sec. 22 min., 9 sec. Didn’t sit (n=39) 40 sec. 7 sec. 8 min., 58 sec. Formative Evaluation of SOS (n=50): Median Time Minimum TimeMaximum Time Sat down (n=30) 5 min., 54 sec. 51 sec. 30 min., 17 sec. Didn’t sit (n=20) 2 min., 12 sec. 30 sec. 7 min., 30 sec.
SMM Science on a Sphere Evaluation Footprints Tracking Report (n=73): Percent of Visitors Stood in one place 82% Circled less than half 12% Circled half or more 3% Circled entire exhibit 3% Formative Evaluation of the Sphere (n=50): Percent of Visitors Stood in one place 26% Circled less than half 26% Circled half or more 12% Circled entire exhibit 36%
Blue Planet Report Blue Planet (6 min., 30 sec.) was set up to run continuously. This study had two parts: sampling visitors for baseline data and sampling visitors who had viewed Blue Planet. Interviews took place in March and April of 2008. A total of 200 visitors were interviewed, 100 Blue Planet visitors and 100 baseline visitors. SMM Science on a Sphere Evaluation
SMM Science on a Sphere Evaluation Blue PlanetMedian TimeMinimum TimeMaximum Time Sat down (n=84) 6 min., 13 sec. 1 min., 10 sec. 19 min., 55 sec. Didn’t sit (n=16) 2 min., 3 sec. 1 min., 13 sec. 6 min., 38 sec. FootprintsMedian TimeMinimum TimeMaximum Time Sat down (n=34) 6 min., 37 sec. 30 sec. 22 min., 9 sec. Didn’t sit (n=39) 40 sec. 7 sec. 8 min., 58 sec. Formative Median TimeMinimum TimeMaximum Time Sat down (n=30) 5 min., 54 sec. 51 sec. 30 min., 17 sec. Didn’t sit (n=20) 2 min., 12 sec. 30 sec. 7 min., 30 sec.
SMM Science on a Sphere Evaluation Blue PlanetFootprintsFormative Stood in one place 60% 82% 26% Circled less than half 27% 12% 26% Circled half or more 4% 3% 12% Circled entire exhibit 9% 3% 36%
SMM Science on a Sphere Evaluation Responses to Why is the Earth called the Blue Planet? Base-line VisitorsBlue Planet Viewers The Earth is mostly water 62% 68% The Earth is made of ___% water 10% 12% Planet with water or as seen from space 13% 15% Because it’s blue 2% 1% Gases or Atmosphere 7% 0% Other 1% 1% I don’t know 5% 3%
SMM Science on a Sphere Evaluation Percentages of visitors who answered correctly the questions Why is Earth called the Blue Planet? and How much of Earth’s water can humans use? Visitors broken down in to baseline visitors, Blue Planet film viewers, and viewers who watched specifically the Blue Planet explanation and 1% of Earth’s water explanation. Correct answers to Correct answers to Why is the Earth How much of Earth’s called the Blue Planet? Earth’s water can humans use? Baseline Visitors 86% 7% Blue Planet film viewers 90% 57%
Kirsten Ellenbogen, Ph.D. Director of Evaluation and Research in Learning 651-221-2560 kellenbogen@smm.org Amy Grack Nelson Evaluation and Research Associate 651-221-4575 agnelson@smm.org www.smm.org/researchandeval/ Contact Information
The Onion – July 30, 2008 Al Gore puts infant son in rocket to escape dying planet.
SMM Science on a Sphere Evaluation Hot ExhibitsPercent of VisitorsMedian Time Desert Animals 42% 0:00:48 Extremes 52% 0:00:50 Water Cycle 88% 0:00:43 Scale 58% 0:00:56 Science on a Sphere 85% 0:02:00 Water Use 73% 0:00:45 3 Gorges 44% 0:01:10 Crops 63% 0:00:50 Dam Removal 75% 0:01:05 Groundwater 54% 0:01:12 Theater 50% 0:05:19 Water Pump 65% 0:00:65 Microscopes 38% 0:00:47