HIV/AIDS Prevalence and Incidence Rates in Arizona Counties (1998-2002)
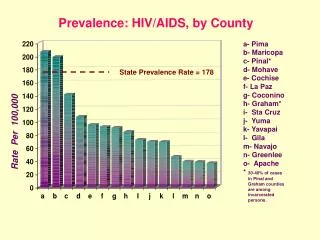
This report examines the prevalence and incidence of HIV/AIDS across various counties in Arizona from 1998 to 2002. Notably, Pinal and Graham counties show a concerning 30-40% of cases among incarcerated individuals. The overall state prevalence rate stands at 178 cases per 100,000 residents, with a new incidence rate of 13.3 cases per 100,000. Through a detailed county-by-county analysis, we highlight ongoing public health challenges and the need for targeted interventions, particularly in areas with a high proportion of cases among the incarcerated population.

HIV/AIDS Prevalence and Incidence Rates in Arizona Counties (1998-2002)
E N D
Presentation Transcript
Prevalence: HIV/AIDS, by County a- Pima b- Maricopa c- Pinal* d- Mohave e- Cochise f- La Paz g- Coconino h- Graham* i- Sta Cruz j- Yuma k- Yavapai l- Gila m- Navajo n- Greenlee o- Apache* 30-40% of cases in Pinal and Graham counties are among incarcerated persons. State Prevalence Rate = 178 Rate Per 100,000
Incidence: New HIV/AIDS Cases 1998-2002, by County a- Maricopa b- Pima c- Pinal* d- Graham* e- La Paz f- Mohave g- Sta Cruz h-Yavapai i- Coconino j- Cochise k- Navajo l- Yuma m- Gila n- Apache o- Greenlee * 30-40% of cases in Pinal and Graham counties are among incarcerated persons. State Incidence Rate = 13.3 Rate Per 100,000
HIV/AIDS Events Per Year in Arizona, 1981-2002 HIV Diagnosis AIDS Diagnosis Number of Cases Resident in Arizona deceased Year of Event: HIV Diagnosis, AIDS Diagnosis, Death