Download
1 / 66
660 likes | 889 Vues
Weather Stations and Disease Warning Systems for Apple and Grape. What are they and what can they do for you?. Patty McManus and Steve Jordan. What are we talking about?. Disease warning system Disease risk advisory system Disease forecasting system Disease prediction system.

E N D
Weather Stations and Disease Warning Systems for Apple and Grape What are they and what can they do for you? Patty McManus and Steve Jordan
What are we talking about? • Disease warning system • Disease risk advisory system • Disease forecasting system • Disease prediction system
What are we talking about? Disease model • Mathematical formula that you plug environmental data into • Can be very simple (e.g., degree days) or more complex requiring a computer Models use quantitative data (e.g., amount of rain, temperature, % RH, number of hours of leaf wetness) Disease warning systems usually include qualitative information (e.g., cultivar, growth stage, disease history)
Disease Warning Systems • Based on sound science, validated in real orchards, but not foolproof • Environmental conditions vary across an orchard or vineyard and even within a canopy • Individuals in a fungal population vary in their optimal temperature/wetness requirements for germination and growth • Different cultivars differ in susceptibility • IPM tool to be used with other IPM tools
Main Objective Improve your understanding of environmental monitoring equipment and disease warning systems so that you can use the technology to your best advantage.
Collecting Environmental Data • On-site instruments (e.g., Spectrum, Hobo, Metos, Campbell); most require computer software to run models. • Remotely sensed data (e.g., Skybit), advisory e-mailed or faxed daily.
Purchasing a Weather Station • Number of makes and models available • Spectrum, Hobo, Metos, Campbell • What suits your needs and budget (and disease models)
Necessary Components • temperature sensor • Relative humidity sensor • Typically housed within a radiation shield
Necessary Components • Leaf Wetness Sensor • Measures the duration of water on the surface of “leaves” • Northern exposure is optimum (last to dry out) • Necessary for most models
Necessary Components • Rain Gauge • Number of different types • Tipping bucket most common
Other Useful Components • Anemometer • used for measuring wind speed • Avoid spray drift • Weather vane • Wind direction
Powering your Weather Station • Number of options depending on your weather station • Small batteries (AA, 9 Volt, etc..) • Cheap, reliable? • Marine battery • Relatively affordable, but must charge or change out batteries periodically • Solar panel • Self-sustaining, can be unreliable depending on weather and energy needs of the weather station • Direct line from a power grid • Ideal, but requires close proximity to a power source and wiring compatiblity to the weather station
Communicating with your Weather Station • “Read-out” display on station • Simplest way • Can limit the amount of information available • Requires interacting directly with the station • Data shuttle or laptop computer • Download data to a small data shuttle or laptop • Requires interacting directly with the station • Permanent cable link to a computer • Buried computer cable from you desktop to the weather station • Great if vineyard is next to your house
Communicating with your Weather Station • line-modem link • Weather station is linked to a phone line • Uses a modem to download and send data to your computer • mains power supply and telephone point necessary • Cellular modem link • Uses a cellular modem (think cell phone) to send data to your computer • Does not require a main power supply or telephone point, so good for a remote station • Requires good cellular reception • Can be expensive
Major diseases, especially eastern North America • Warning systems commercially available Apple scab Fire blight Sooty blotch-flyspeck
For scab and fire blight: • Biology as it relates to warning systems • Origin and development of the systems • How to make them work for you • Take-home message
Secondary infections Fall LWD and temp to identify infection periods Degree-day model estimates % of ascospores mature Primary infections Spring Ascospores Scab Biology
Origin and Development ofScab Warning Systems • Degree-day model for estimating percentage of ascospores mature • Leaf wetness- and temperature- based model for identifying infection periods (Mills)
Scab Infection Period Models • Mills as modified by Jones • Temperature and leaf wetness duration (LWD) hours • Established “Light,” “Medium,” and “Heavy” infection periods • Washington State model requires more LWD hours at temps below 47 oF • Cornell model requires the fewest LWD hours at all temperatures and does away with L,M, and H infection periods
Often overlooked points: • LWD hours required for infection are approximate, not absolute • Scab fungus exists as a population of individuals with a range of germination/infection requirements • Models often developed and validated under “worst-case” scenario: • Highly susceptible cultivar • “Abundant” inoculum
Making the scab infectionmodel work for you • What it will do: • Identify when conditions have been favorable for infection (assumes presence of spores and susceptible cultivar) • What it won’t do: • Predict the amount of scab that develops • Predict when scab will appear • Amount of scab that develops depends on amount of inoculum, cultivar susceptibility, and tissue age
Making the scab infectionmodel work for you • Rely primarily on preventing infection with protectant fungicides • When spraying post-infection, use appropriate fungicides • Don’t count on 4 days “kick-back” from sterol inhibitor or strobilurin fungicides
Making the scab infectionmodels work for you Scab warning systems are IPM tools that work best if integrated with inoculum reduction and host resistance Keeping records of weather and infection periods helps you sort out what went wrong when, so that you can do better in the future
Take-home Message • Scab warning systems are IPM tools that work best if integrated with inoculum reduction, host resistance, and a preventative spray schedule.
Canker blight Blossom blight Erwinia amylovora: doubles every 30 minutes on stigma
Internal movement of bacteria... …causes shoot infections
Bacteria spread by rain, wind, possibly insects to new shoots… …shoot blight
Rootstock Blight Most deadly form of fire blight Not accounted for by fire blight warning systems
Special challenges withfire blight • Disease development is explosive: • Pathogen grows exponentially • Can infect with just minutes of wetness • Pathogen can persist asymptomatically, or in hard-to-find cankers, from year to year in apple trees
Special challenges withfire blight • Internal and systemic nature of the pathogen limits the effectiveness of chemicals and pruning • Streptomycin is the only consistently effective bactericide • Sporadic disease, so we tend to forget stuff and repeat mistakes!
Origin and Development ofFire Blight Warning Systems • Two most used systems in North America: • Maryblyt: P. Steiner, Univ. Maryland • Cougarblight: T. Smith, Wash. State Univ.
Maryblyt and Cougarblight • Both require: • Open blossoms • Accumulation of degree hours (DH) sufficient for E. amylovora to multiply on the stigma • Rain or dew to wash the pathogen into nectarthodes
Maryblyt and Cougarblight • Key differences: • Maryblyt assumes presence of pathogen; Cougarblight incorporates fire blight history into the risk assessment • Maryblyt predicts the onset of symptoms; Cougarblight provides low, marginal, high, or extreme infection risk warning
Which should you use? • E. amylovora is VERY sensitive to environment • Disease warning systems tend to perform best in the region(s) in which they were developed and validated
Maryblyt • Predicts infection and onset of symptoms: • Canker blight • Blossom blight • Shoot blight • Trauma blight
Starting at green tip,196 DD (base 55F) Canker Blight
103 DD (base 55F) Blossom Blight INFECTION • 198 DH (base 65F) within the last 80 DD (base 40F) • 2. Heavy dew or 0.01 inch rain during current day or 0.1 inch rain previous day • 3. Current daily average temp 60F or more
E. amylovora population is building up on stigma, and EIP approaches 100 EIP = 100 is the infection threshold EIP = 100 reached after 198 DH (base 65F) within the last 80 DD (base 40F) Epiphytic Inoculum Potential (EIP)
EIP is dynamic • Maryblyt assumes cold weather or streptomycin will reduce E. amylovora to marginal levels • A 3-day cool period reduces EIP to 0, unless EIP had previously exceeded 200 • After streptomycin application, EIP is reset to zero
103 DD (base 55F) and daily average temp 60F or more Shoot Blight Trauma Blight Wind, rainsplash, insects (?)
Do insects spread E. amylovora and/or facilitate infection? White apple leafhopper—NO Potato leafhopper—MAYBE Green apple aphid—NO
Making fire blight warningsystems work for you • What they will do: • Indicate when blossom infection is likely • Guide timing of streptomycin application during bloom (best if applied before infection) • Predict the onset of symptoms to guide scouting early removal of diseased tissues • What they won’t do: • Predict rootstock blight • Save a lot of sprays in any one year • Substitute for common sense
Take-home Messages • Sporadic, explosive, systemic nature of fire blight makes it impossible to control in some years despite timely sprays and removal of diseased tissues • Cost savings of using warning systems will be realized over several years
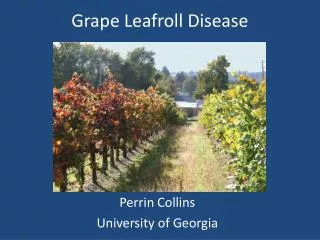
Grape Disease Models • 5 Models currently available • Powdery mildew • Phomopsis cane and leaf spot • Botrytis • Downy mildew • Black rot
Powdery Mildew • Requires air temperature and leaf wetness • Predicts two infectious stages, an ascospore stage and a conidial stage • Ascospores are released in the spring from overwintering structures (primary infections) • Ascospore infection period described as “Heavy” • Condia are released from lesions through the growing season (secondary infections) • Conidial Index: 0 - 30 = Light infection risk 40 - 50 = Medium infection risk 60 - 100 = Heavy infection risk
Phomopsis Cane and Leaf Spot • Requires air temperature,leaf wetness, and rain data • Developed using two different varieties, Catawba and Seyval • Risk calculated as expected number of lesions per leaf • 1 – 30 = light infection risk 31 – 90 = medium infection risk 90 + = heavy infection risk