Download
1 / 1
10 likes | 192 Vues
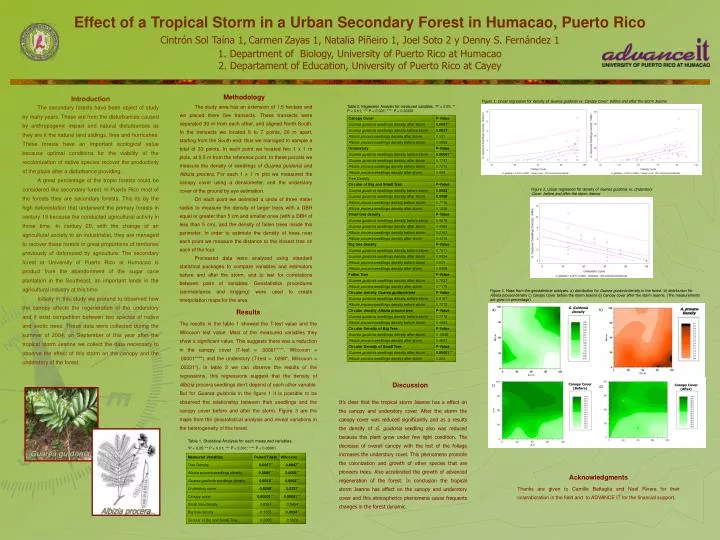
Figure 1. Linear regression for density of Guarea guidonia vs. Canopy Cover before and after the storm Jeanne. Figure 2. Linear regression for density of Guarea guidonia vs. Understory Cover before and after the storm Jeanne. A. procera Density. G. Guidonia Density. Canopy Cover (Before).

E N D
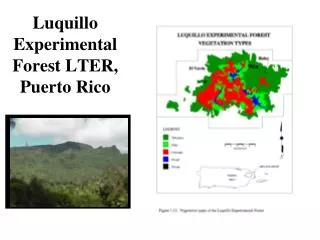
Figure 1. Linear regression for density of Guarea guidonia vs. Canopy Cover before and after the storm Jeanne Figure 2. Linear regression for density of Guarea guidonia vs. Understory Cover before and after the storm Jeanne A. procera Density G. Guidonia Density Canopy Cover (Before) Guarea guidonia Albizia procera Effect of a Tropical Storm in a Urban Secondary Forest in Humacao, Puerto Rico Cintrón Sol Taína 1,,CarmenZayas 1, Natalia Piñeiro 1, Joel Soto 2 y Denny S. Fernández 1 1. Department of Biology, University of Puerto Rico at Humacao 2. Departament of Education, University of Puerto Rico at Cayey Methodology The study area has an extension of 1.5 hectare and we placed there five transects. These transects were separated 30 m from each other, and aligned North-South. In the transects we located 6 to 7 points, 20 m apart, starting from the South end; thus we managed to sample a total of 33 points. In each point we located two 1 x 1 m plots, at 0.5 m from the reference point. In these parcels we measure the density of seedlings of Guarea guidonia and Albizia procera. For each 1 x 1 m plot we measured the canopy cover using a densiometer, and the understory cover of the ground by eye estimation. On each point we delimited a circle of three meter radius to measure the density of larger trees with a DBH equal or greater than 5 cm and smaller ones (with a DBH of less than 5 cm), and the density of fallen trees inside this perimeter. In order to estimate the density of trees near each point we measure the distance to the closest tree on each of the four. Processed data were analyzed using standard statistical packages to compare variables and estimators before and after the storm, and to test for correlations between pairs of variables. Geostatistics procedures (semivariance and krigging) were used to create interpolation maps for the area. Introduction The secondary forestshave been object of study by many years. These are from the disturbances caused by anthropogenic impact and natural disturbances as they are it the natural land slidings, fires and hurricanes. These forests have an important ecological value because optimal conditions for the viability of the recolonization of native species recover the productivity of the place after a disturbance providing. A great percentage of the tropic forests could be considered like secondary forest. In Puerto Rico most of the forests they are secondary forests. This its by the high deforestation that underwent the primary forests in century 19 because the conducted agricultural activity in those time. In century 20, with the change of an agricultural society to an industrialist, they are managed to recover these forests in great proportions of territories previously of deforested by agriculture. The secondary forest at University of Puerto Rico at Humacao is product from the abandonment of the sugar cane plantation in the Southeast, an important lands in the agricultural industry at this time. Initially in this study we pretend to observed how the canopy affects the regeneration of the understory and if exist competition between two species of native and exotic trees. These data were collected during the summer of 2004, on September of this year after the tropical storm Jeanne we collect the data necessary to observe the effect of this storm on the canopy and the understory of the forest. Table 2. Regression Analysis for measured variables. *P < 0.05; ** P < 0.01; *** P < 0.001; **** P < 0.00001 Figure 3. Maps from the geostatistical analyses. a) distribution for Guarea guidonia densityin the forest. b) distribution forAlbizia procera density c) Canopy Cover before the storm Jeanned) Canopy cover after the storm Jeanne. (The measurements are given in percentage) a) b) Results The results in the table 1 showed the T-test value and the Wilcoxon test value. Most of the measured variables they show a significant value. This suggests there was a reduction in the canopy cover (T-test = .00001****, Wilcoxon = .00001****) and the understory (T-test = .0268*, Wilcoxon = .00231*). In table 2 we can observe the results of the regressions, this regressions suggest that the density of Albizia procera seedlings don’t depend of each other variable. But for Guarea guidonia in the figure 1 it is possible to be observed the relationship between their seedlings and the canopy cover before and after the storm. Figure 3 are the maps from the geostatistical analysis and reveal variations in the heterogeneity of this forest. Discussion c) Canopy Cover (After) d) It’s clear that the tropical storm Jeanne has a effect on the canopy and understory cover. After the storm the canopy cover was reduced significantly and as a results the density of G. guidonia seedling also was reduced because this plant grow under few light condition. The decrease of overall canopy with the lost of the foliage increases the understory cover. This phenomena promote the colonization and growth of other species that are pioneers trees. Also accelerated the growth of advanced regeneration of the forest. In conclusion the tropical storm Jeanne has effect on the canopy and understory cover and this atmospherics phenomena cause frequents changes in the forest dynamic. Table 1. Statistical Analysis for each measured variables. *P < 0.05; ** P < 0.01; *** P < 0.001; **** P < 0.00001 Acknowledgments Thanks are given to Camille Battaglia and Noel Rivera for their colaraboration in the field and to ADVANCE IT for the financial support.