Download
1 / 1
10 likes | 141 Vues
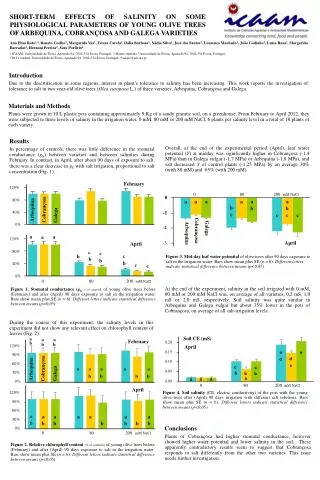
120%. 0 80 200 mM NaCl. 90%. 0. a. a. a. a. a. a. 60%. b. b. b. 30%. -1. c. c. c. c. 0%. -2. Galega. Cobrançosa. Arbequina. April. -3. 120%. 90%. 60%. February. 30%. 120%. 120%. 0%. 80%. 80%.

E N D
120% 0 80 200mM NaCl 90% 0 a a a a a a 60% b b b 30% -1 c c c c 0% -2 Galega Cobrançosa Arbequina April -3 120% 90% 60% February 30% 120% 120% 0% 80% 80% Cobrançosa Galega Arbequina 40% 40% 0% 0% Soil CE (mS) 0,20 April e 0,15 e d d 0,10 c c c 0,05 b b b a a a a 0,00 0 80 200mM NaCl a a a February b b b Cobrançosa Arbequina a a a a a Galega b b b b SHORT-TERM EFFECTS OF SALINITY ON SOME PHYSIOLOGICAL PARAMETERS OF YOUNG OLIVE TREES OF ARBEQUINA, COBRANÇOSA AND GALEGA VARIETIES Ana Elisa Rato1,4, Renato Coelho1, Margarida Vaz1, Teresa Carola2, Dália Barbosa2, Nádia Silva1, José dos Santos2, Lourenço Machado2, João Godinho2, Luzia Ruas2, Margarida Barradas2, Hernani Pereira2, Sara Porfírio4 1 ICAAM, Universidade de Évora, Apartado 94, 7002-554 Évora, Portugal; 2 Master students, Universidade de Évora, Apartado 94, 7002-554 Évora, Portugal; 3 Ph.D. student, Universidade de Évora, Apartado 94, 7002-554 Évora, Portugal; 4 aerato@uevora.pt Introduction Due to the desertification in some regions, interest in plant’s tolerance to salinity has been increasing. This work reports the investigation of tolerance to salt in two year-old olive trees (Olea europaea L.) of three varieties, Arbequina, Cobrançosa and Galega. Materials and Methods Plants were grown in 10 L plastic pots containing approximately 9 Kg of a sandy granitic soil, on a greenhouse. From February to April 2012, they were subjected to three levels of salinity in the irrigation water, 0 mM, 80 mM or 200 mM NaCl, 6 plants per salinity level in a total of 18 plants of each variety. Results In percentage of controls, there was little difference in the stomatal conductance (gS) between varieties and between salinities during February. In contrast, in April, after about 90 days of exposure to salt, there was a clear decrease in gSwith salt irrigation, proportional to salt concentration (Fig. 1). Overall, at the end of the experimental period (April), leaf water potential (Y) at midday was significantly higher in Cobrançosa (-1,4 MPa) than in Galega vulgar (-1,7 MPa) or Arbequina (-1,8 MPa), and salt decreased Y of control plants (-1,25 MPa) by an average 30% (with 80 mM) and 65% (with 200 mM). a a a April c Figure 3.Mid-day leaf water potential of olive trees after 90 days exposure to salt in the irrigation water. Bars show mean plus SE (n = 6). Different letters indicate statistical difference between means (p<0,05). c c b b b b c c 0 80 200mM NaCl At the end of the experiment, salinity in the soil irrigated with 0 mM, 80 mM or 200 mM NaCl was, on average of all varieties, 0,2 mS, 1,0 mS or 2,0 mS, respectively. Soil salinity was quite similar in Arbequina and Galega vulgar but about 35% lower in the pots of Cobrançosa, on average of all salt-irrigation levels. Figure 1.Stomatal conductance (gS, % of controls) of young olive trees before (February) and after (April) 90 days exposure to salt in the irrigation water. Bars show mean plus SE (n = 6). Different letters indicate statistical difference between means (p<0,05). During the course of this experiment, the salinity levels in this experiment did not show any relevant effect on chlorophyll content of leaves (Fig. 2). April Figure 4.Soil salinity (CE, electric conductivity) of the pots with the young olive trees after (April) 90 days irrigation with different salt solutions. Bars show mean plus SE (n = 6). Different letters indicate statistical difference between means (p<0,05). a a a a a a a b b b b b b b Conclusions Plants of Cobrançosa had higher stomatal conductance, however showed higher water potential and lower salinity in the soil. These apparently contradictory results seem to suggest that Cobrançosa responds to salt differently from the other two varieties. This issue needs further investigation. 0 80 200 mM NaCl Figure 2.Relative chlorophyll content(% of controls) of young olive trees before (February) and after (April) 90 days exposure to salt in the irrigation water. Bars show mean plus SE (n = 6). Different letters indicate statistical difference between means (p<0,05).


