
Correlation of Prediction Error and Tmax in AUC0-24 Concentration Profiles
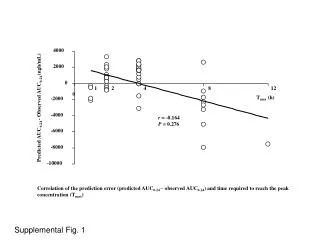
This analysis investigates the correlation between prediction errors of the observed vs. predicted AUC0-24 values (ngh/mL) and the time required to reach peak concentration (Tmax). A dataset consisting of 4000, 2000, and other values was utilized to assess this relationship. The correlation coefficient (r) was found to be -0.164 with a p-value of 0.276, suggesting no significant correlation between the prediction errors and Tmax in the provided observations. Supplemental Figure 1 illustrates the data trends in detail.

Correlation of Prediction Error and Tmax in AUC0-24 Concentration Profiles
E N D
Presentation Transcript
4000 2000 0 1 2 4 8 12 0 Tmax (h) -2000 Predicted AUC0-24 - Observed AUC0-24 (ngh/mL) -4000 r = -0.164 P = 0.276 -6000 -8000 -10000 Correlation of the prediction error (predicted AUC0-24 – observed AUC0-24) and time required to reach the peak concentration (Tmax) Supplemental Fig. 1