Download
1 / 20
200 likes | 338 Vues
Regional Variations in Vulnerability to Tornado Outbreaks in the Eastern United States. Charles E. Konrad II Maggie M. Kovach Christopher M. Fuhrmann Jordan McLeod Southeast Regional Climate Center Department of Geography University of North Carolina – Chapel Hill. Background.

E N D
Regional Variations in Vulnerability to Tornado Outbreaks in the Eastern United States Charles E. Konrad II Maggie M. Kovach Christopher M. Fuhrmann Jordan McLeod Southeast Regional Climate Center Department of Geography University of North Carolina – Chapel Hill
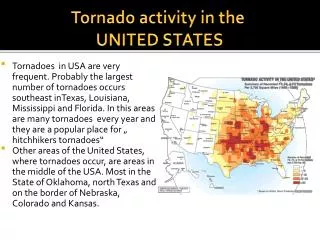
Background Dixie Alley Ashley 2007 • Annual Tornado Reports • Number of Killer Tornado Events
Sutter, Daneil., Kevin M. Simmons Mobile Homes Sutter and Simons 2012 Tornadofatalities by location (1985–2005) • The likelihood of fatality is 20 times greater in mobile homes than in other structures (Brooks and Doswell2002)
Research Question • What are the regional variations in tornado outbreak vulnerability? • How vulnerable are people in the immediate vicinity of a tornado? Once a tornado has touched down, how vulnerable are individuals? • How does population, mobile home density, poverty, and numbers of senior citizens affect vulnerability in the path of a tornado? • What are the secular trends in tornado vulnerability?
Data • Tornado data from 1980 to 2010 obtained from Storm Prediction Center (SPC) using the online SeverePlot tool. • Beginning & ending lat/lon, F/EF level of tornado, # deaths & injuries of every reported tornado. • Underreporting of tornadoes not an issue during the study period.
Data (continued) Census data Tract level: 1990 & 2000 Population • Pover Poverty Senior Citizens # of mobile homes
Methodology A. Estimate the population and # of mobile homes in a 500 m buffer around each tornado track in the database.Tornadoes observedEarly period: 1980-1995 1990 censusLate period: 1996-2010 2000 censusB. Record/calculate the following for each tornado:1. EF-level2. Track length3. Adjusted Fujita miles (Track length * EF-level)4. Number of deaths5. Number of deaths per km of track6. Exposed population, elderly, poverty7. Exposed population/km, elderly/km, poverty/km8. Exposed mobile homes9. Exposed mobile homes/km
C. Compare differences between the early and late period.- Stratify by EF level (EF1-3 vs. EF4-5) and night/day occurrence- Compare differences at the regional scale Methodology (con’d)
Results • Deaths per km along track of tornadoes • Secular trends in: • a. Deaths • b. Population, # elderly, #poverty, number of mobile homes in the immediate vicinity of tornadoes
Percentage Change in Quantity 1980-1995 1996-2010 • Changes significant at the .10 and.05 level are in blueandbolded blue, respectively.
Regional Breakdown Northern Plains NE Midwest Southern Plains Southeast
Summary • Focus on vulnerability in the immediate vicinity of a tornado • Greatest in South, especially FL (.039/km), lowest in Northern Plains (.0025) Association with pop density, # mobile homes. • Secular changes: 1996-2010 vs. 1980-1995 for entire region • 31% in deaths overall. 57% for EF1-EF3 tornadoes • 24% in track length • 52% in mobile homes • 6% deaths/ km • 16% mobile homes/km • 14% elderly/km • 17% poverty/km
Summary (continued) • Greatest secular increases observed in nocturnal tornadoes, especially South and Midwest • 56% in deaths overall. 57% for EF1-EF3 tornadoes • 31% in track length • 72% in mobile homes • 19% deaths/ km • 16% mobile homes/km • 5% elderly/km • 8% poverty/km
Current work • Apply a much larger buffer (100 km around each tornado track) and compare with 1km buffer. • Rationale: Large buffer identifies the region within which each tornado may have tracked given slightly different initial conditions (e.g. location of supercell development). • This addresses the vagaries of where tornadoes just happen to develop.
Example of 100 km buffer for tornado that tracks from downtown Tampa through downtown Orlando
Percentage Change in Quantity 1980-1995 1996-2010 1 km buffer 100 km buffer
Questions? Chip Konrad konrad@unc.edu