Download
1 / 20
210 likes | 381 Vues
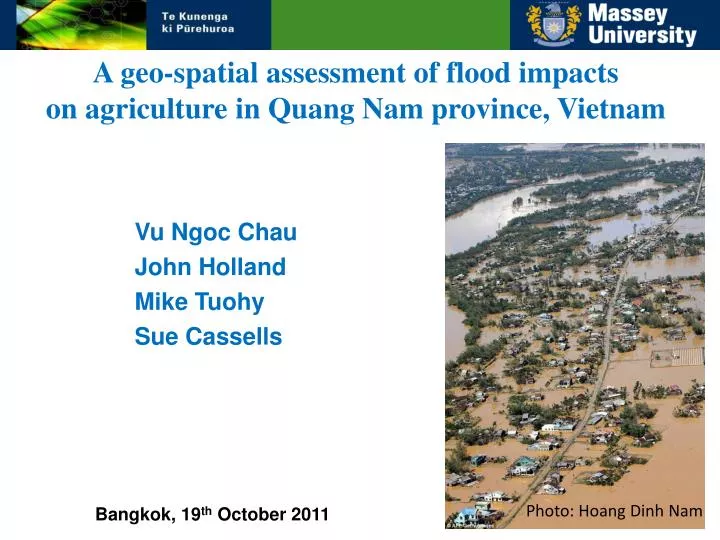
A geo-spatial assessment of flood impacts on agriculture in Quang Nam province, Vietnam. Vu Ngoc Chau John Holland Mike Tuohy Sue Cassells. Photo: Hoang Dinh Nam. Bangkok, 19 th October 2011. Presentation Outline. Problem statement Background Methodology Results

E N D
A geo-spatial assessment of flood impacts on agriculture in Quang Nam province, Vietnam Vu Ngoc Chau John Holland Mike Tuohy Sue Cassells Photo: Hoang Dinh Nam Bangkok, 19th October 2011
Presentation Outline • Problem statement • Background • Methodology • Results • Conclusion and recommendations
Problem statement • Despite advances in technology, agriculture still relies upon natural weather patterns and climate cycles for its productivity • The recent weather events highlight Vietnam’s vulnerability • Little research has been done to linking flood models with economic models • Aim of this stage: To undertake a geo-spatial assessment of flood impacts on agriculture in Quang Nam province.
Backgound • Area: 10,400 km2 • Coastline: 85 km • Mountainous and highland areas: 80% of land • Tropical monsoon climate zone • Prone to natural disasters • Population: 1.5 million • Mostly agricultural province • GDP: USD 447 mill (2010). Sources: General Statistics Office of Quang Nam Quang Nam’s topography and river systems.
Background Sources: General Statistics Office of QuangNam.
Background Percentage of labour force by sector – Quang Nam 2007 Source: www.gms-eoc.org/CEP/Comp4/docs/ISDP/Group_VNM.pdf
Background Quang Nam agriculture: • More than 80% of population live in rural areas and rely upon agriculture • 65% of the provincial labor force • Main source of income • 20% of province’s GDP annually HOWEVER,
Background DienBan district - Quang Nam Photo: Vũ Trung A village completely flooded in QuangNam on Oct. 1, 2009. National highway No.1 at DuyXuyen District inundated in the November 2007 flood. Photograph by: Hoang Dinh Nam, AFP/Getty Images
Methodology Identify natural extreme events Analyzing events Agriculture sector Quantifying events’ impacts on agriculture
Results Type, frequency and influential level of extreme events in Quang Nam.
Results > 90% of damages caused by floods. Source: Central Committee for Flood and Storm Control http://www.ccfsc.gov.vn/dmis/Reports.aspx?cat=3
Results • Average annual rainfall: 2612 mm • 75% of annual rainfall drops in Sep – Dec • Steep slopes and short rivers • On the East: national highway No.1, rail way, sand dunes, high tides • On the West: Mountain. Flood in Quang Nam province • Floods are: • Frequent • High intensity • Sharp peak • High magnitude. • The inundation basin considered comparatively closed; • Assume that the basin is a retarding basin; • Using DEM to identify the possible inundation risk impacts on agriculture.
Results Flood scenarios: Source: Nguyen Ba Quy, 2011
Results Flood scenarios: Distribution of inundation depth of historical flood ( flood in 2009) extracted from DEM30. Distribution of inundation depth at 20 years return period flood ( flood in 2007) extracted from DEM30.
Results Land use affected by historical flood (110,951ha – 11% total area). Land use affected by 20 years RP flood (76,515ha – 7% total area).
Results The impacts of flood scenarios in Quang Nam. Note: The agricultural land include: agricultural, aquaculturaland salt production land.
Conclusion • Agriculture is very vulnerable to floods: • 20 year RP: 30% of agricultural land, 36% of rice land • Historical: 41% of agricultural land, 47% of rice land. • Most impact: populated, flat and highest agricultural production areas • Combined with likely sea level rise, impacts are likely to be greater.
Recommendations Flooding can not and should not be eliminated: - Keep flood and people separate or - Live with flooding. Hard and soft solutions are needed to mitigate the impacts: - Early warning system - Emergency response plan - Recovery plan - Construction measures. Flood risk analysis based on CBA is necessary to evaluate the effectiveness and feasibility of proposed solutions.
References Benito, G., & Hudson, p. (2010). Flood hazards: the context of fluvial geomorphology. In I. Alcántara & A. Goudie (Eds.), Geomorphological hazards and disaster prevention (pp. 111 - 128). Cambridge ; New York: Cambridge University Press. Crozier, M., & Glade, T. (2010). Hazard assessment for risk analysis and risk management. In I. Alcántara & A. Goudie (Eds.), Geomorphological hazards and disaster prevention (pp. 221 - 232). Cambridge ; New York: Cambridge University Press. Curtis, A., & Mills, J. W. (2010). GIS, Human Geography and Disasters. Dasgupta, S., Laplante, B., Meisner, C., Wheeler, D., & Yan, J. (2009). The impact of sea level rise on developing countries: a comparative analysis. Climatic Change, 93(3), 379-388. doi: 10.1007/s10584-008-9499-5 Gupta, A. (2010). The hazardousness of high-magnitude floods. In I. Alcántara & A. Goudie (Eds.), Geomorphological hazards and disaster prevention (pp. 97-110). Cambridge ; New York: Cambridge University Press. Kendra, J. M. (2007). Geography's contributions to understanding hazards and disasters. Disciplines, Disasters and Emergency Management, 15-30. Merz, B., Thieken, A., & Kreibich, H. (2011). Quantification of socio-economic flood risks. In A. H. Schumann (Ed.), Flood risk assessment and management : how to specify hydrological loads, their consequences and uncertainties (pp. 229-248). London, New York: Springer. Pradhan, B. (2010). Role of GIS in natural hazard detection, modeling and mitigation. Disaster Advances, 3(1), 34. Scally, R. (2006). GIS for environmental management. Redlands, Calif.: ESRI Press. Schumann, A. H. (2011). Introduction- Hydrological aspects of risk management. In A. H. Schumann (Ed.), Flood risk assessment and management : how to specify hydrological loads, their consequences and uncertainties (pp. 1-10). London, New York: Springer. Tran, P., & Shaw, R. (2009). Enhancing community resilience through information management: Flood risk mapping in Central Vietnam. In P. K. Joshi (Ed.), Geoinformatics for natural resource management (pp. vii, 634 p. : ill. (some col.), maps (some col.) ; 627 cm). New York :: Nova Science Publishers. Westen, C. J. v. (2010). Geo-information technology for hazard risk assessment: Univerity of Twente. Westen, C. V. (2010). GIS for assessment of risk from geomorphological hazards. In I. Alcántara & A. Goudie (Eds.), Geomorphological hazards and disaster prevention (pp. 205 - 220). Cambridge ; New York: Cambridge University Press. Zhao, Y., Li, S., & Zhang, Y. (2005). Early detection and monitoring of drought and flood in China using remote sensing and GIS. In M. V. K. Siva Kumar, R. P. Motha & H. P. Das (Eds.), Natural disasters and extreme events in agriculture: impacts and mitigation (pp. 367). Berlin ; New York :: Springer.