A High-Throughput Path Metric for Multi-Hop Wireless Routing
230 likes | 364 Vues
A High-Throughput Path Metric for Multi-Hop Wireless Routing. Presenter: Gregory Filpus Slides borrowed and modified from: Douglas S. J. De Couto MIT CSAIL (LCS) Daniel Aguayo, John Bicket, and Robert Morris http://pdos.lcs.mit.edu/grid. Indoor wireless network.

A High-Throughput Path Metric for Multi-Hop Wireless Routing
E N D
Presentation Transcript
A High-Throughput Path Metric for Multi-Hop Wireless Routing Presenter: Gregory Filpus Slides borrowed and modified from: Douglas S. J. De Couto MIT CSAIL (LCS) Daniel Aguayo, John Bicket, and Robert Morris http://pdos.lcs.mit.edu/grid
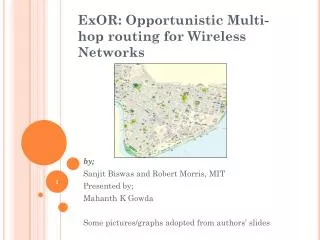
Indoor wireless network 29 PCs with 802.11b radios (fixed transmit power) in ‘ad hoc’ mode 2nd floor 3rd floor 5th floor 4th floor 6th floor
Better Testbed UDP throughput better
What throughput is possible? ‘Best’ for each pair is highest measured throughput of 10 promising static routes. Routing protocol ‘Best’
Throughput differs between paths Paths from 23 to 36
Talk outline • Testbed throughput problems • Wireless routing challenges • A new high-throughput metric (ETX) • Evaluation
Challenge: more hops, less throughput • Links in route share radio spectrum • Extra hops reduce throughput Throughput = 1 Throughput = 1/2 Throughput = 1/3
‘Good’ ‘Bad’ Challenge: many links are lossy One-hop broadcast delivery ratios Smooth link distribution complicates link classification.
Challenge: many links are asymmetric Broadcast delivery ratios in both link directions. Very asymmetric link. Many links are good in one direction, but lossy in the other.
Hop-count alone is insufficient B Delivery ratio = 100% 100% Minimize hop-count C A 20% If algorithm ignoring loss sees A>C as a link, it’ll choose A>C instead of A>B>C. Trade-off between hops and distance (Thus lossiness)- need to account for delivery rate in routing.
A straw-man route metric B 100% 50% Maximize bottleneck throughput C A 51% 51% D A-B-C = 50% A-D-C = 51% Bottleneck throughput: A-B-C : ABBABBABB = 33% A-D-C : AADDAADD = 25% Actual throughput:
Another straw-man metric B Maximize end-to-end delivery ratio 100% 51% C A 50% A-B-C = 51% A-C = 50% End-to-end delivery ratio: A-B-C : ABBABBABB = 33% A-C : AAAAAAAA = 50% Actual throughput:
New metric: ETX Minimize total transmissions per packet (ETX, ‘Expected Transmission Count’) Link throughput 1/ Link ETX Delivery Ratio Link ETX Throughput 100% 100% 1 50% 50% 2 33% 33% 3
Calculating link ETX Assuming 802.11 link-layer acknowledgments (ACKs) and retransmissions: P(TX success) = P(Data success) P(ACK success) Link ETX = 1 / P(TX success) = 1 / [ P(Data success) P(ACK success) ] Estimating link ETX: P(Data success) measured fwd delivery ratio rfwd P(ACK success) measured rev delivery ratio rrev Link ETX 1 / (rfwd rrev)
Route ETX Route ETX = Sum of link ETXs Route ETX Throughput 1 100% 2 50% 2 50% 3 33% 5 20%
ETX Properties • ETX predicts throughput for short routes (1, 2, and 3 hops) • ETX quantifies loss • ETX quantifies asymmetry • ETX quantifies throughput reduction of longer routes
Measuring delivery ratios • Each node broadcasts small link probes (134 bytes), once per second • Nodes remember probes received over past 10 seconds • Reverse delivery ratios estimated as rrev pkts received / pkts sent • Forward delivery ratios obtained from neighbors (piggybacked on probes)
ETX caveats • ETX link probes are susceptible to MAC unfairness and hidden terminals • Route ETX measurements change under load • ETX estimates are based on measurements of a single link probe size (134 bytes) • Under-estimates data loss ratios, over-estimates ACK loss ratios • ETX assumes all links run at one bit-rate
Evaluation Setup • Indoor network, 802.11b, ‘ad hoc’ mode • 1 Mbps, 1 mW, small packets (134 bytes), RTS/CTS disabled • DSDV + modifications to respect metrics • Packets are routed using route table snapshot to avoid route instability under load. • DSR + modifications to respect metrics
DSDV overhead ETX improves DSDV throughput DSDV+hop-count better DSDV+ETX ‘Best’
DSR with ETX DSR+hop-count DSR+ETX ‘Best’
Some related work • Threshold-based techniques • DARPA PRNet, 1970s–80s [Jubin87]: Minimum hop-count, ignore ‘bad’ links (delivery ratio 5/8 in either direction) • Link handshaking [Lundgren02, Chin02]: Nodes exchange neighbor sets to filter out asymmetric links. • SNR-based approaches [Hu02]: Mark low-SNR links as ‘bad’, and avoid them • Mote sensors [Yarvis02] • Product of link delivery ratios
Summary • ETX is a new route metric for multi-hop wireless networks • ETX accounts for • Throughput reduction of extra hops • Lossy and asymmetric links • Link-layer acknowledgements • ETX finds better routes!