Download

1 / 17
170 likes | 287 Vues
This report outlines the quality assurance practices established for real-time wave data collected in Southern California from 1975 to the present. It covers the specifications of analysis techniques for ensuring uniformity and quality in final products, as mandated by the U.S. Army Corps of Engineers. It details automated data quality control procedures utilized by the National Data Buoy Center, calibration protocols for pressure sensors, and quality control specifications for various buoy types. The report addresses issues related to data transmission, system diagnostics, and coverage percentages across multiple locations.

E N D
COASTALDATAINFORMATIONPROGRAM1975 - present Quality Assurance of Real-Time Data February 2004
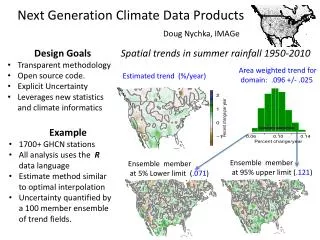
Real-Time Web Products Southern California Summary Map Nowcast Model Products
1995: Wave Data Standards Analysis – US Army Corps of Engineers “… provide specifications on the analysis techniques that must be applied to wave data ….to ensure quality and uniformity of the final product. … The standard has evolved through a consensual approach involving the principal organizations which are responsible for the vast majority of wave measurements for this country. “ 2003: Handbook of Automated Data Quality Control Checks and Procedure of the National Data Buoy Center
QUALITY ASSURANCEPressure Sensor Calibration DEEP TANK Soak complete package (sensors & cable) – Establish noise floor • COLD BOX • Constant Temperature • Standard Paros • Battery of statistical test of dynamic pressure responses over several weeks to establish noise floor.
Generated from Aceh, Indonesia earthquake on Dec 26, 2005 @ 00:59UTC.
Quality Control SpecificationsPressure Sensors: Time Domain • Max Wave Height Test • Flat episodes Test • Spike Test • Max value Test: successive trough to crest • Min Value Test: successive trough to crest • Mean Shift Test • Equal Peaks Test • Acceleration Test • Mean crossing Test • Period Distribution Test
Quality Control SpecificationsWave Buoys: Frequency Domain • Check Factors Test – ratio of vertical to horizontal displacement • Inclination Test • Period exceedence Test Quality of Telemetery: • Discontinuities in transmission • Data Corruption
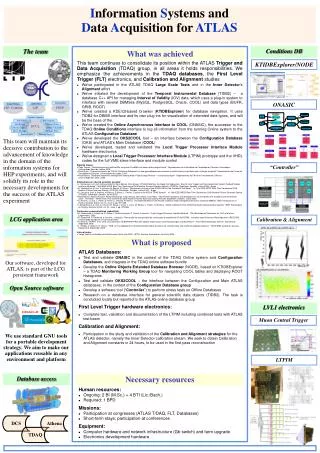
Central Computer Automated Real-Time Processing Time Series Time Domain Quality Control Frequency Domain PRODUCTS NWS/NDBC Transmission Station Specific Requests WEB UPDATEReal-Time/Historical Pub/Non-Public STORAGE rawspectralparameters Error/Diagnostic Statistics Post Processing Inter-comparison of last 24 hours
Waimea Buoy, HA – Frequency Domain QC 106: First indicated bad by TP errors > 30s -106 01 07/11/2003 20:19:30 hrs UTC code=551: (bdd_editor.f) Tp out of bounds: 33.33 Flagged as NON-PUB 7/11/03 BAD – Energy in Low Frequency for all records
Scripps Canyon NorthWest BuoyFrequency Domain QCCheck factor values 114 0108/16/2003 00:39:30 hrs UTC code=500: (bdd_editor.f) Abnormally high check factors (relationship between vertical and horizontal cross-spectra) Calibration Test – Bad displacement Direction & Period erratic. Retrieved buoy and performed calibration tests.
Wave Data Torrey Pines Inner – 20m deep Torrey Pines Outer – 549m deep Buoys approximately 6 miles apart
Dana Point Buoy, CA First indicated bad by inclination errors (> 5°) • 096 01 09/13/2003 18:59:30 hrs UTC code=702: (buoy_stats.f) Inclination off, arch: 58.52 file: 52.73 GOOD DISPLACEMENT PLOT BAD – Exagerrated Horizontal Amplitude
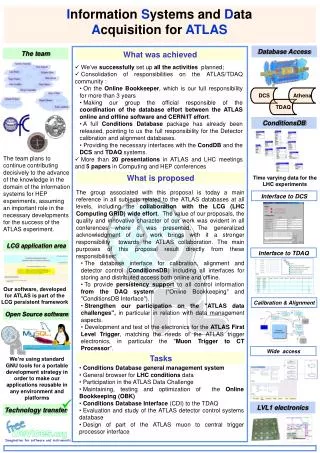
Modeling Waves Across the Basin Headland shadowing Refractive effects Directional wave buoy to initiate model Island shadowing Diffraction effects Amplificationover shoals
Pacific Gas & Electric Company Diablo Canyon Nuclear Power Plant 2004
CDIP In-House Diagnostics • Paged: • off site (GPS & ARGOS) • data is > 1 hr old, • computer system is down, • computer partitions are > 90% full. • Programmers emailed : • Offsite • Data > 1 hr old, power outages, data transfer failedSystem messages
CDIP Diagnostics 2004- Data Collection Coverage Percentages --------------------------------- La Jolla – 99.89% Torrey Pines O – 95.29% San Pedro – 95.24 Santa Monica – 99.64% Pt Dume – 95.88% Goleta – 97.06% Harvest – 94.70% Pt. Reyes – 91.88% Grays Harbor – 99.31% Guam – 99.72%