Download
1 / 17
170 likes | 310 Vues
Non-Equilibrium Ionization Modeling of the Current Sheet in a Simulated Solar Eruption. Chengcai Shen Co-authors : K. K. Reeves , J. C. Raymond, N. A. Murphy, Y-K. Ko , J. Lin, Z. Mikić 2013-2-11. Contents. Introduction: CME/flare current sheets

E N D
Non-Equilibrium Ionization Modeling of the Current Sheet in a Simulated Solar Eruption ChengcaiShen Co-authors: K. K. Reeves , J. C. Raymond, N. A. Murphy, Y-K. Ko, J. Lin, Z. Mikić 2013-2-11
Contents • Introduction: CME/flare current sheets • Calculation of non-equilibrium ionization • Results • Ionization features in current sheets • Predicted SDO/AIA images • Predicted SOHO/UVCS intensity • Conclusion
The CME/flare current sheet Takasao et al. 2012 UVCS observation (e.g., Ciaravellaet al. 2002). LASCO white light observation (e.g., Webb et al. 2003 , Ko et al. 2003) XRT observation (e.g., Savage et al. 2010) AIA observation (e.g., Savage et al. 2011, Takasao et al. 2012,) Ciaravella et al. 2002
Time-dependent ionization process • Time-dependent ionization processes are important in the current sheet because that the dynamic time scale could be shorter than the ionization time scale.
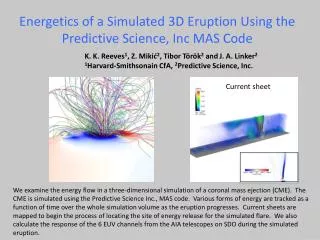
In this work, we focus on time-dependent ionization inside a large scale and dynamically developed CME/flare current sheet. • We use the 2.5D simulation results of CME eruption model developed by Reeves et al. 2010. • This model includes Ohmic and coronal heating, thermal conduction, and radiative cooling in the energy equation. • The evolution of the CME/flare with time and the distributions of temperature and plasma density around the CME/flare current sheet are known on the 2D plane. (Reeves et al. 2010)
2. Calculation of non-equilibrium ionization • Solve time-dependent ionization equation: • where fi is ionic fraction, ne is electron density, Ci and Riare the ionization rate and recombination rates for this ion. • The second-order implicit scheme or the fourth-order explicit Runge-Kutta method are used. • Ciand Ridepend strongly on the temperature.
2. Calculation of non-equilibrium ionization • Get history of temperature and density for each plasma cell in the Lagrangian framework. • Using a predictor-corrector method, we solve the motion equation and integrate the velocities backwards in time to get the plasma trajectories • According to the position of trajectory at different time, get temperature and density through bilinear interpolation in space. • Spline interpolation with time.
4. Results The ionization properties of the current sheet Near the low end of the sheet (e.g., point A), the charge state distribution is skewed toward lower charge states compared to equilibrium ionization results . At the top end (point B), on the other hand, the profiles are shifted toward higher charges states Temperature
Results • The features of the reconnection inflow and outflow affect the properties of the ionization processes. • The current sheet plasma is under-ionized at low heights and over-ionized at large heights. Velocity Vx Velocity Vy
Results: Predicted AIA images • The total AIA count rate includes He, C, N, O, Ne, Na, Mg, Al, Si, S, Ar, Ca, Fe and Ni. • The intensity of the current sheet center is significantly different in the non-equilibrium result and the bright thin current sheet region extends higher in the AIA 94Å and 131Å channels.
The intensity profiles along the x-direction across the sheet.
Outside the current sheet • The difference between time-dependent ionization and equilibrium cases depends on height. • Define the relative difference of emission between time-dependent calculations and equilibrium ionization as: Center of the current sheet (a) In the lower part of sheet, the intensities are smaller for AIA 94Å & 131Å but larger for other AIA channels. In the higher part of sheet, the case is reversed. (b) In ambient regions, the equilibrium assumption is not appropriate at higher altitude.
Results: Predicted UV intensity Inside the current sheet, the Fe XVIII 975Å profile shows that the maximum peak is located in the center of sheet. The Ca XIV 943Å, Si XII 499Åand O VI 1032Å profiles are less bright.
Predicted UV intensity • A low intensity region surrounds the current sheet. • The sheath is deeper in the non-equilibrium results than the equilibrium case. • The low intensity sheath feature can be enhanced by the time-dependent ionization process. (b)x=0.012, the temperature increases to around 3x10⁶K in a short period, the time-dependent ionization strongly affects the charge state profiles and causes the appearance of lower temperature (< 3 x 10⁶ K) ionization features.
A similar low temperature sheath may be found in space observations. • For Fe XVIII, the center of the sheet is at a position angle 255 and the low ionization sheath is clear at about PA = 262.
4. Conclusion Thank you!