Download
1 / 4
40 likes | 64 Vues
If you are using Cognos Analytics as a beginner, you might not be able to explore its complete features, by opting for an online Cognos Training that will help you to understand its features in detail.

E N D
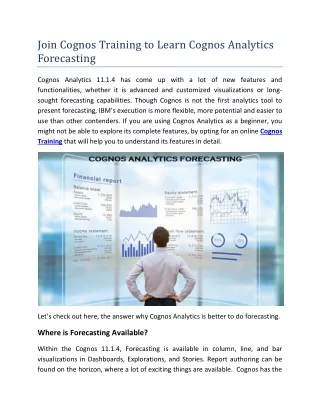
Join Cognos Training to Learn Cognos Analytics Forecasting Cognos Analytics 11.1.4 has come up with a lot of new features and functionalities, whether it is advanced and customized visualizations or long- sought forecasting capabilities. Though Cognos is not the first analytics tool to present forecasting, IBM’s execution is more flexible, more potential and easier to use than other contenders. If you are using Cognos Analytics as a beginner, you might not be able to explore its complete features, by opting for an online Cognos Training that will help you to understand its features in detail. Let’s check out here, the answer why Cognos Analytics is better to do forecasting. Where is Forecasting Available? Within the Cognos 11.1.4, Forecasting is available in column, line, and bar visualizations in Dashboards, Explorations, and Stories. Report authoring can be found on the horizon, where a lot of exciting things are available. Cognos has the
capability to forecast columns and bar charts that is not available in Tableau and Power BI. It hides the forecasting button until the following criteria are matched by visualization. ✓Visualization of an Appropriate Form (Line, Bar or Column) ✓Visualization is Determined in the Y-axis ✓Visualization Gets a Time Aspect in the X-axis Once all these criteria are completed, the forecast key appears next to the insights button at the top right of the visualization. Single Category Forecasts For single category forecasts, click the forecast key, turn the features on and here you’ll get Cognos Analytics forecast. After applying the forecast, you can notice an instant and radical change in the line. Forecasting automatically informs and controls time sorting chronologically. Yes, that’s absolutely true; it automatically reorganizes the time groups in sequential order, not according to alphanumeric order. It is also believed that IBM
is going to provide this amazing feature in all the visualizations, not only for forecasts. Multi-category Forecasts When adding a particular type in a specific table, Cognos immediately implements the forecast for every individual category. This definite feature of Cognos is an advantage over Power BI that only shows single category forecasts. And, it makes discovering data with forecasting faster and easier. Interacting with forecasts Balancing over a particular point in the forecast will help you to attain the upper bound, forecast and lower bound for that connection of the chart. Forecast pop- ups highlight the confidence interval calculated by Cognos. Clicking on the line of specific projection will sort the dashboard by this category, displays the selected category into visual focus and plot the confidence intervals as they develop in the forecast. Configuring forecasts When you press the forecast button, forecast configuration options will appear in the menu. Let’s give an overview of these options here: Forecast periods: It will show the number of periods present in the forecast. The default ‘Auto’ option will predict 20% onwards. If you have data of 10 months, it will auto-generate an extra 2 months of forecast. Ignore last periods:This option is useful for cases where you don’t have complete data at your end in a chart. For example, if you only have data of a few days in a month, it ignores this incomplete period to create a more precise forecast. Confidence level: Monitor and maintain the confidence level shown on the tool tip and confidence visualizations options as 90%, 95% and 99%.
Seasonality: Cognos automatically sense seasonal transformations in the data and records them in its forecasts. The default ‘Auto’ setting will construct numerous models with various seasonal periods and select the suitable one, so you can identify a seasoning period by entering numbers here. This last option is incredibly influential and is a strong advantage for Cognos against Power BI and Tableau that they are unable to detect and record seasonal variations. All the advanced forecasting features of Cognos are really incredible. If you want to get a thorough knowledge about its implementations advanced functionalities, enroll in ExistBI's Cognos Training now! ExistBI has offices in the US, UK and Europe, contact them today for more details.