Genetic Markers and Chromosomal Analysis in Human Studies
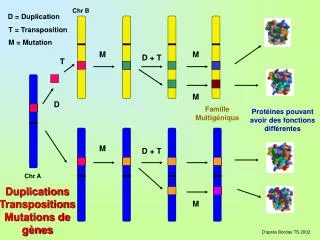
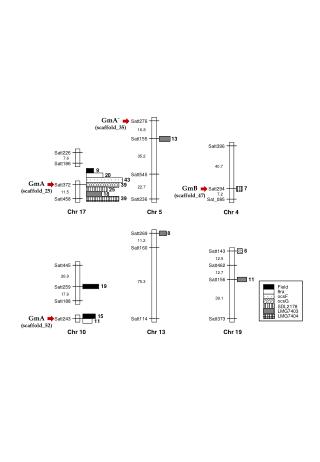
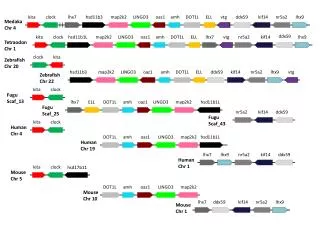
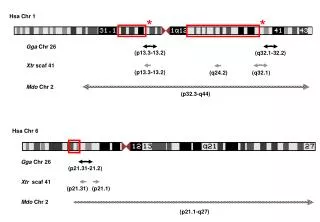
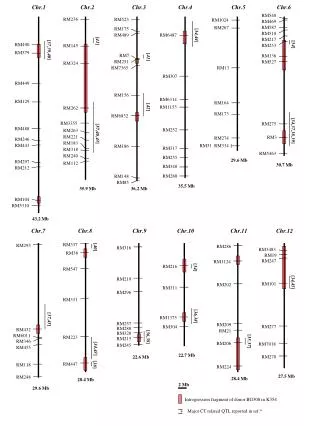
This study analyzes a series of genetic markers across various chromosomes (Chr I to Chr V) and linkage groups (LG) to understand their associations with specific traits. The data includes information on centiMorgans (cM) and physical distances to evaluate the relationships between genetic markers and phenotypes. Investigating the variations represented through numerical values offers insights into genetic diversity and evolutionary trends among populations. The findings contribute significantly to the fields of genetics and genomics.

Genetic Markers and Chromosomal Analysis in Human Studies
E N D
Presentation Transcript
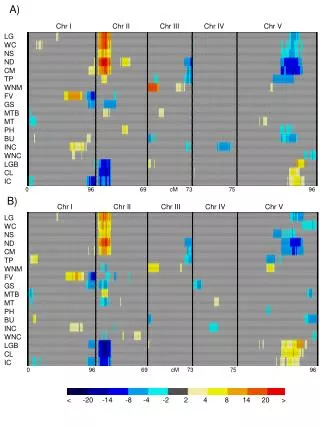
A) Chr I Chr II Chr III Chr IV Chr V LG WC NS ND CM TP WNM FV GS MTB MT PH BU INC WNC LGB CL IC 0 96 69 cM 73 75 96 B) Chr I Chr II Chr III Chr IV Chr V LG WC NS ND CM TP WNM FV GS MTB MT PH BU INC WNC LGB CL IC 0 96 69 cM 73 75 96 < -20 -14 -8 -4 -2 2 4 8 14 20 >