Download
1 / 17
170 likes | 314 Vues
U.S. Super-Regional Testbed for Improving Forecasts of Environmental Processes for the U.S. Atlantic and Gulf of Mexico Coasts. The Role of the SURA Testbed in the Improvement of U.S. Coastal and Estuarine Prediction. John Harding, Northern Gulf Institute

E N D
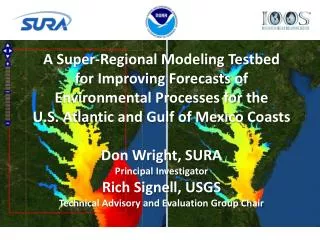
U.S. Super-Regional Testbed for Improving Forecasts of Environmental Processes for the U.S. Atlantic and Gulf of Mexico Coasts The Role of the SURA Testbed in the Improvement of U.S. Coastal and Estuarine Prediction John Harding, Northern Gulf Institute Carl Friedrichs, Virginia Institute of Marine Science Rick Luettich, University of North Carolina, Chapel Hill Rich Signell, United States Geological Survey Coastal Zone 2011 19 July2011
U.S. Super-Regional Testbed Goals • Build a common infrastructure for access, analysis and visualization of all ocean model data produced by the Federal Backbone and the IOOS Regions. • Develop skill metrics and assess models in three different regions and dynamical regimes • Transition models, tools, toolkits and other capabilities to federal operational facilities • Build stronger relationships between academia and operational centers through collaboration http://testbed.sura.org/
U.S. IOOS Testbed Team Structure 8 members 25 members Don Wright, SURA Rich Signell, USGS Doug Levin, NOAA/IOOS Liz Smith, SURA EoinHowlett, ASA 20 members 21 members 17 members Carl Friedrichs, VIMS John Harding, NGI Rick Luettich, UNC-CH http://testbed.sura.org/
Inundation Extra-tropical – Gulf of MaineTropical – Gulf of Mexico- 4 models: 3 unstructured grid +1 structured grid- Coupled wave-storm surge-inundation (TWL)- Consistent forcing, validation and skill assessment using existing IMEDS tool • Extensive observational data sets for historical storms Ike and Rita in standard formats • SURA has secured NSF TeraGrid supercomputer resources Extratropical Grid Tropical Grids for Galveston Bay
Domains CI Challenge (unstructured grids & multi-plots) Gulf of Maine with high resolution nesting in Scituate, MA Nested 5620 nodes 10 m – 1 km horiz resolution
Statistical Analyses Temporal correlation Quantile-Quantile (distributions) Peak event (peak over threshold) Error Metrics RMS Error Bias, Angular bias Scatter Index Circular correlation Performance (Skill) Scores IMEDS – Interactive Model Evaluation and Diagnostics System CI Challenge (tools) • Stand-alone desktop model validation toolkit • Based on NOAA standards • Robust error metrics: Erms, bias, Scatter Index, Skill Score • Explore model errors as a function of time, space, event Parameters Added To-Date
April 2007 “Patriot’s Day Storm”Interesting Science & CI Challenge (multi-plots) Currents w/o waves Currents w waves April 18, 04 AM (GMT)
Estuarine Hypoxia Chesapeake Bay 1. Estuary: – 5 Hydrodynamic models (so far) – 6 Hydro-DO model pairs (so far) – 2004 data from up to 40 CBP stations – Comparing T, S, max (dS/dz), DO via target diagrams 2. Shelf: OBCs 5 hydrodynamic models Dissolved Oxygen Stratification (dS/Dz) Std dev of observations Std dev of observations Models doing better on oxygen than stratification!
Observations: S and DO from Up to 40 CBP station locations CI Challenge (data storage and formats) Data set for model skill assessment: ~ 40 EPA Chesapeake Bay stations Each sampled ~ 20 times in 2004 Temperature, Salinity, Dissolved Oxygen Map of Late July 2004 Observed Dissolved Oxygen [mg/L] (http://earthobservatory.nasa.gov/Features/ChesapeakeBay)
Skill Metrics: Target diagram CI Challenge (tools) Dimensionless version of plot normalizes by standard deviation of observations (modified from M. Friedrichs)
Dissolved Oxygen: Top-to-Bottom DS and Bottom DO in Central Chesapeake Bay Interesting Science & CI Challenge (tools & multi-plots) • ChesROMS-1term • model • All models reproduce DO better than they reproduce stratification. • If stratification is not controlling DO, what is? (by M. Scully)
Shelf Hypoxia Gulf of MexicoCompare Hydrodynamic & biogeochemical hindcastcomparisons of hypoxia model (stand alone) coupled to 3 different Gulf of Mexico hydrodynamic models Evaluate two shelf hypoxia formulations (NOAA & EPA) Assist transition of Navy AMSEAS Gulf Forecasts and NOAA OceanNOMADS data server
Interesting Science & CI Challenge (tools & multi-plots) Compare simulated surface chlorophyll and SeaWiFS climatology (June example). HYCOM b.c. Climb.c. IASFNFS b.c. SeaWiFS Preliminary analyses indicate no systematic differences among simulations IASNFS b.c. HYCOM b.c. Climb.c. Log(chl)SeaWiFS Corr = 0.84 Corr = 0.72 Corr = 0.71 Log(chl) model Courtesy Katja Fennel
Where Does Hypoxic Bottom Water Come From?Interesting Science & CI Challenge (Lagrangian tools) Oxygen (mg/l) 1 7 Courtesy Bruce Lipphardt, U. Delaware
Model Evaluations – AMSEAS-GOM – Forecast Days 1 – JUNE 2010 CI Challenge (tools & multi-plots) Sonic Layer Depth (SLD) with Temperature and Salinity at Surface & 100m Courtesy Frank Bub, NAVOCEANO
NGI & NCDDC EDAC/ OceanNOMADS Improve Access to Gulf Data & Predictions FY11 NODC OceanNOMADS Transition Milestone & CI Challenge (distributed data) NCEP OPC for Near-Term Ocean Prediction Access EDAC for Long-Term Archive & NCEP Backup Surface Currents http://www.northerngulfinstitute.org/edac/ocean_nomads.php
U.S. Super-Regional Testbed Goals • Build a common infrastructure for access, analysis and visualization of all ocean model data produced by the Federal Backbone and the IOOS Regions. • Develop skill metrics and assess models in three different regions and dynamical regimes • Transition models, tools, toolkits and other capabilities to federal operational facilities • Build stronger relationships between academia and operational centers through collaboration http://testbed.sura.org/node/429