Cost Allocation Strategies for Efficient Resource Utilization
Learn about the purposes and methods of cost allocation, including predicting economic effects, motivating departments, and computing income. Gain insight into allocating variable and fixed costs, with examples and step-by-step guidelines.

Cost Allocation Strategies for Efficient Resource Utilization
E N D
Presentation Transcript
Cost Allocation Chapter 12
Learning Objective 1 • Explain the major reasons • for allocating costs.
Purposes of Allocation Cost allocation supports a company’s cost management system. Strategic decision making Operational control External reporting
Purposes of Allocation There are four major purposes for allocating costs: 1. To predict the economic effects of planning and control decisions 2. To obtain desired motivation 3. To compute income and asset valuation 4. To justify costs or obtain reimbursement
Product Service Three Types of Cost Objectives 1 – Service departments 2 – Producing departments 3 – Final cost objective
Learning Objective 2 • Allocate the variable and fixed • costs of service departments • to other organizational units.
Establish the details regarding cost allocation in advance. 1 Allocate variable- and fixed- cost pools separately. 2 Evaluate performance using budgets. 3 General Guidelines for Allocating Service Department Costs
School of Business School of Engineering Service Department Example 5-year lease Computer Department
Service Department Example Suppose there are two major purposes for the allocation: Predicting economic effects of the use of the computer Motivating departments and individuals to use its capabilities more fully
Service Department Example The primary activity performed is computer processing. Resources consumed include processing time, operator time, consulting time, energy, materials, and building space.
Service Department Example Suppose the university performed cost behavior analysis. The budget formula for the forthcoming year is $100,000 monthly fixed cost plus $200 variable cost per hour of computer time used.
Variable-Cost Pool The cost driver for the variable-cost pool is actual hours of computer time used. Therefore, variable costs should be allocated as follows: Budgeted unit rate ×Actual hours of computer time used
Variable-Cost Pool Consider the allocation of variable costs to a department that uses 600 hours of computer time. 600 hours × $200 = $120,000 Suppose inefficiencies in the computer department caused the variable costs to be $140,000 instead of $120,000.
Variable-Cost Pool A good cost-allocation scheme would allocate only the $120,000 to the consuming department and would let the $20,000 remain as an unallocated unfavorable budget variance of the computer department.
Fixed-Cost Pool The cost driver for the fixed-cost pool is the amount of capacity required when the computer facilities were acquired. Fixed costs should be allocated as follows: Budgeted percent of capacityavailable for use × Total budgeted fixed costs
Fixed-Cost Pool Suppose the deans had originally predicted the long-run average monthly usage as follows: School of Business: 210 hours School of Engineering: 490 hours
Fixed-Cost Pool How is the fixed-cost pool allocated? Business: 210 ÷ 700 × $100,000 = $30,000 Engineering: 490 ÷ 700 × $100,000 = $70,000
Fixed-Cost Pool This predetermined lump-sum approach is based on the long-run capacity available to the user, regardless of actual usage from month to month.
Learning Objective 3 • Use the direct and step-down • methods to allocate service • department costs to user • departments.
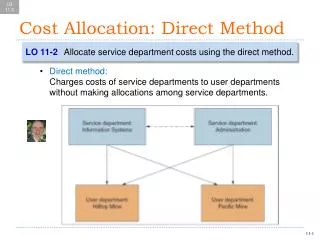
Reciprocal Services Service departments often support other service departments in addition to production departments. There are two popular methods for allocating service department costs: The direct method The step-down method
Direct and Step-Down Methods The direct method ignores other service departments when any given service department’s costs are allocated to the revenue-producing (operating) departments. The step-down method recognizes that some service departments support the activities in other service departments as well as those in production departments.
Direct and Step-Down Methods Facilities management cost = $1,260,000 Human resources cost = $240,000 Total square footage in production departments: 15,000 processing + 3,000 assembly = 18,000 Total employees in production departments 16 processing + 64 assembly = 80 Square footage in human resources = 9,000
Direct Method Facilities management cost allocated to processing = (15,000 ÷ 18,000) × $1,260,000 = $1,050,000 Facilities management cost allocated to assembly = (3,000 ÷ 18,000) × $1,260,000 = $210,000
Direct Method Human resources cost allocated to processing = (16 ÷ 80) × $240,000 = $48,000 Human resources cost allocated to assembly = (64 ÷ 80) × $240,000 = $192,000
Step-Down Method Facilities management allocation: To human resources: (9 ÷ 27) × $1,260,000 = $420,000 To processing: (15 ÷ 27) × $1,260,000 = $700,000 To assembly: (3 ÷ 27) × $1,260,000 = $140,000
Step-Down Method Human resources allocation: $240,000 + $420,000 = $660,000 To processing: (16 ÷ 80) × $660,000 = $132,000 To assembly: (64 ÷ 80) × $660,000 = $528,000
Step-Down Method Processing department Direct costs $1,000,000 From facilities management 700,000 From human resources 132,000 Total $1,832,000
Step-Down Method Assembly department Direct costs $1,600,000 From facilities management 140,000 From human resources 528,000 Total $2,268,000
Identify additional cost drivers. 1 Allocate all costs by the direct or step-down method. 2 Costs Not Related to Cost Drivers Guidelines:
Learning Objective 4 • Integrate service-department • allocation systems with traditional • and ABC systems to allocate total • systems costs to final cost • objectives.
Direct costs Indirect costs Traditional Approach 1. Divide the costs in each producing departments. 2. Assign direct costs to the appropriate products, services, or customers.
Cost pool Cost pool Cost pool Traditional Approach 3. Select one or more cost pools and related cost drivers in each production department. Indirect departmental costs
Product A Product B Product C Traditional Approach 4. Allocate costs Costs
Step 1: Determine the key components of the system. Step 2: Develop the relationships among resources, activities, and cost objectives. Activity-Based Costing
Step 4: Calculate and interpret the new activity-based cost information. Activity-Based Costing Step 3: Collect relevant data concerning costs and the physical flow of the cost-driver units among resources and activities.
Learning Objective 5 • Allocate the central corporate • costs of an organization.
Allocation of Central Costs Many managers believe it is desirable to fully allocate all costs to the revenue- producing parts of the organization. Whenever possible, the preferred driver for central services is usage.
Not always economically viable Allocation of Central Costs Usage Revenue Total assets Cost of goods sold Total cost of each division
Learning Objective 6 • Allocate joint costs to products • using the physical-units and • relative-sales-value methods.
Allocation of Joint Costs Joint costs Split-off point
Joint Costs Two conventional ways of allocating joint costs to products are widely used: Relative sales values Physical units
Physical-Units Method The physical-units method requires a common physical unit for measuring the output of each product. The joint costs are allocated based on each product’s percentage of the total physical units produced.
Product X $66,667 Joint cost: $100,000 Product Y $33,333 X and Y sales value at split-off point: $90,000 X and $30,000 Y Physical-Units Example 1,000,000 liters of X 10 ÷ 15 × $100,000 500,000 litters of Y 5 ÷ 15 × $100,000
Physical-Units Example • X YTotal • Sales value $90,000 $30,000 $120,000 • Allocation of joint cost 66,667 33,333 100,000 • Operating profit (loss) $23,333 $ (3,333) $ 20,000
Relative-Sales-Value Method The joint costs are allocated based on each product’s sales value as a percentage of the total sales value at split-off.
Product X $75,000 Product Y $25,000 X and Y sales value at split-off point: $90,000 X and $30,000 Y Relative-Sales-Value Method 1,000,000 liters of X 90 ÷ 120 × $100,000 Joint cost: $100,000 500,000 litters of Y 30 ÷ 120 × $100,000
Relative-Sales-Value Method This method can be used when one or more of the joint product cannot be sold at the split-off point. Sales value at split-off = Final sales value – Separable costs
By-Product Costs A by-product is not individually identifiable until manufacturing reaches a split-off point. They have relatively insignificant sales value.
By-Product Costs If an item is accounted for as a by-product, only separable costs are allocated to it. All joint costs are allocated to the main products. Any revenues from by-products, less their separable costs, are deducted from the cost of the main products.