Download
1 / 150
1.52k likes | 1.77k Vues
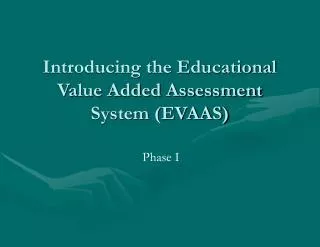
The Power of EVAAS. Making the Most of Your Data To Inform and Improve Teaching and Learning Swain County Schools March 8, 2013. Today’s Presenters. Joyce Gardner Professional Development Consultant Region 8 Joyce.gardner@dpi.nc.gov. Becky Pearson Professional Development Consultant

E N D
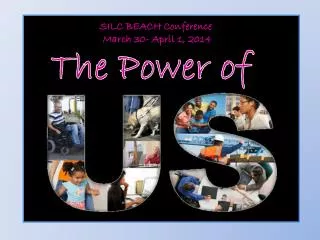
The Power of EVAAS Making the Most of Your Data To Inform and Improve Teaching and Learning Swain County SchoolsMarch 8, 2013
Today’s Presenters Joyce Gardner Professional Development Consultant Region 8 Joyce.gardner@dpi.nc.gov Becky Pearson Professional Development Consultant Region 8 becky.pearson@dpi.nc.gov Jason Rhodes Professional Development Consultant Region 8 email@dpi.nc.gov
Welcome, Introductions, Agenda Overview Pre Assessment EVAAS Basics Diving into Reports LeveragingEVAAS to Change Instruction Agenda
Outcomes • Explore and understand the EVAAS philosophy • Understand and use various EVAAS reports • Using report data to drive changes in teaching that will impact student learning
Virtual Resources Data Literacy Module https://center.ncsu.edu/nc
Don’t forget: You can copy-paste this slide into other presentations, and move or resize the poll. Poll: I am very familiar with the Educator Val...
Don’t forget: You can copy-paste this slide into other presentations, and move or resize the poll. Poll: I know how to log in to the EVAAS websit...
Don’t forget: You can copy-paste this slide into other presentations, and move or resize the poll. Poll: I know how to navigate the EVAAS website...
Don’t forget: You can copy-paste this slide into other presentations, and move or resize the poll. Poll: I understand EVAAS report names
Don’t forget: You can copy-paste this slide into other presentations, and move or resize the poll. Poll: I know how to use the EVAAS website to g...
Don’t forget: You can copy-paste this slide into other presentations, and move or resize the poll. Poll: I know how to access EVAAS reports for i...
Don’t forget: You can copy-paste this slide into other presentations, and move or resize the poll. Poll: I am able to analyze the metrics in EVAA...
Don’t forget: You can copy-paste this slide into other presentations, and move or resize the poll. Poll: I know how to collect evidence from EVAA...
Don’t forget: You can copy-paste this slide into other presentations, and move or resize the poll. Poll: I know how to interpret the following re...
Don’t forget: You can copy-paste this slide into other presentations, and move or resize the poll. Poll: I am able to communicate the findings of...
Don’t forget: You can copy-paste this slide into other presentations, and move or resize the poll. Poll: I am able to use data analysis to initia...
What is Data Literacy? The understanding needed to: • Find • Evaluate • Utilize data to inform instruction.
A data literate person possesses the knowledge to gather, analyze, and graphically convey information to support short and long-term decision-making. A Data Literate Person Can…
Table Talk • What is EVAAS? • How are you currently using EVAAS? • What benefits/difficulties have you experienced? • What have you learned?
Benefits and Considerations for Teachers • Understand academic preparedness of students before they enter the classroom. • Monitor student progress, ensuring growth opportunities for all students. • Modify curriculum, student support, and instructional strategies to address the needs of all students. Professional Development is the Key • Data Conversations / True PLCs • Culture of School • Sensitivity of Data • Finger Pointing and Blame Game • Window vs. Mirror
NC Professional Teaching Standards Standard I: Teachers demonstrate leadership. Take responsibility for the progress of all students Use data to organize, plan, and set goals Use a variety of assessment data throughout the year to evaluate progress Analyze data Standard IV: Teachers facilitate learning for their students. Use data for short and long range planning Standard V: Teachers are reflective on their practice. Collect and analyze student performance data to improve effectiveness
Standard 6 for Teachers Teachers contribute to the academic success of students. The work of the teacher results in acceptable, measurable progress for students based on established performance expectations using appropriate data to demonstrate growth.
Benefits for Principals Gain a consolidated view of student progress and teacher effectiveness, as well as the impact of instruction and performance. Bring clarity to strategic planning and function as a catalyst for conversations that must take place to ensure that all students reach their potential. Understand and leverage the strengths of effective teachers. Use the valuable resource of effective teaching to benefit as many students as possible.
NC Standards for School Executives Standard 2: Instructional Leadership Focuses his or her own and others’ attention persistently and publicly on learning and teaching by initiating and guiding conversations about instruction and student learning that are oriented towards high expectations and concrete goals; Creates processes for collecting and using student test data and other formative data from other sources for the improvement of instruction Ensures that there is an appropriate and logical alignment between the curriculum of the school and the state’s accountability program Creates processes for collecting and using student test data and other formative data from other sources for the improvement of instruction
Standard 8 for School Executives Academic Achievement Leadership School executives will contribute to the academic success of students. The work of the school executive will result in acceptable, measurable progress for students based on established performance expectations using appropriate data to demonstrate growth.
Changes in Reporting for 2012-13 2011-12 2012-13 Above Exceeds Expected Growth Not Detectably Different Meets Expected Growth Below Does Not Meet Expected Growth
2012-13 Teacher Ratings Categories • Teachers 1 2 3 4 5 6 Contribute to Academic Success Demonstrate Leadership Establish Environment KnowContent Facilitate Learning Reflect on Practice Exceeds Expected Growth Meets Expected Growth • 5 Rating Categories • 3 Rating Categories Not Demonstrated Developing Proficient Accomplished Distinguished Does Not Meet Expected Growth Meets Expected Growth Exceeds Expected Growth Does Not Meet Expected Growth
Table Talk • How do you explain the concept of Achievement vs. Growth?
Student Achievement Proficient End of School Year
Student Growth Proficient Change over time Not Proficient Start of School Year End of School Year
Achievement vs. Growth Student Achievement: Where are we? • Highly correlated with demographic factors Student Growth: How far have we come? • Highly dependent on what happens as a result of schooling rather than on demographic factors
The EVAAS Philosophy • All students deserve opportunities to make appropriate academic progress every year. • There is no “one size fits all” way of educating students who enter a class at different levels of academic achievement.
The EVAAS Philosophy • Adjustments to instruction should be based on the students’ academic needs, not on socio-economic factors. • "What teachers know and can do is the most important influence on what students learn." (National Commission on Teaching and America's Future, 1996)
Achievement and Poverty How is this fair?
Academic Growth and Poverty No one is doomed to failure.
High-Achieving Students and Progress All schools in Tennessee in 2011 - Math students in grades 4 through 8. Districts, schools, and teachers that serve high achieving students can make excellent progress, just as easily as those that serve low achieving students.
Proficiency vs. Growth NO YES YES NO
Table Talk • How could you use the concept of achievement vs. growth when speaking with parents? • How does the achievement vs. growth conversation guide PLCs?
Answers the question of how effective a schooling experience is for learners • Produces reports that • Predict student success • Show the effects of schooling at particular schools • Reveal patterns in subgroup performance
Test Your Knowledge of EVAAS Reports At your tables, you will find copies of a variety of reports available from EVAAS and labels for each report. Working with your group, match the report label with the appropriate report.
District Value Added Report • Use to evaluate the overall effectiveness of a district on student progress • Compares each district to the average district in the state for each subject tested in the given year • Indicates how a district influences student progress in the tested subjects
The School Value Added Report compares each school to the average school in the state. Comparisons are made for each subject tested in the given year and indicate how a school influences student progress in those subjects.