Weekly Equity Market Report
80 likes | 97 Vues
Get Equity Market Tips on Your Mobile and Recommendations in positional tips, intraday trading tips, capital market tips which help you reap maximum profit

Weekly Equity Market Report
E N D
Presentation Transcript
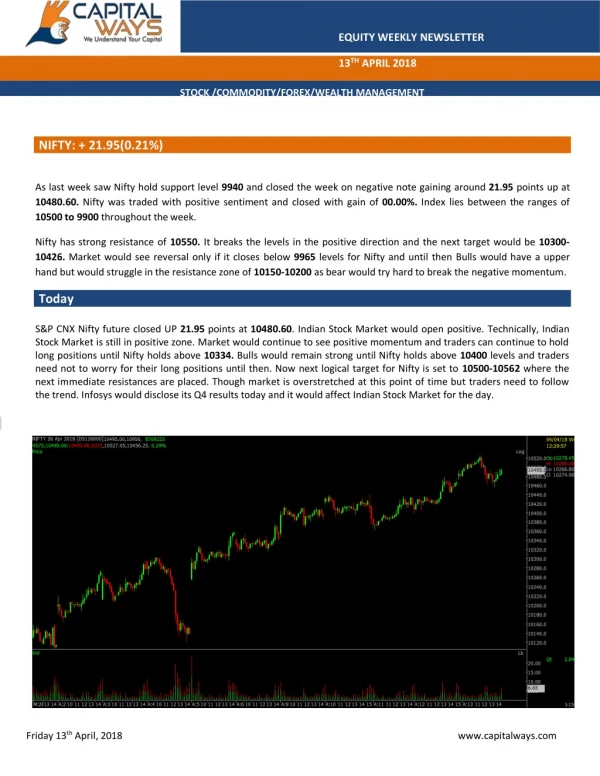
; Weekly Equity Report 04-2-2018 support@starindiaresearch.com8817002233 Nifty Weekly View Nifty trimmed its gains amid volatility and closed last session of the week higher after the government maintained its fiscal discipline, and provided stimulus to farmers and tax payers through several schemes in its last Budget ahead of general elections 2019. The index formed bullish candle on the daily charts, which resembles a 'Shooting Star' kind of pattern while for the week also, it formed bullish candle. Weekly Chart By Senior Researcher – Miss NamrataOtwani
Weekly Newsletters Page 2 ; Open interest for the week G Monday Tuesday Wednesday Thursday Friday 5116425 9887250 12628875 17199075 17940750 8 Most Active Nifty option Scrip Strike price Option type Open Interest Nifty 11000 CE 3156525 Nifty 10700 PE 2969700 Nifty 10800 PE 2022900 www.starindiaresearch.com
Weekly Newsletters Page 3 ; Bank Nifty Weekly View Bank Nifty remained under pressure as it failed to hold above 27,500 zones and drifted towards 27,000 zones. The index closed lower at 27,085.95. It formed a bearish candle on daily charts and a Long Legged Doji on weekly scale which indicates an absence of follow up buying at higher zones. Weekly chart Open interest for the week Monday Tuesday Wednesday Thursday Friday 337960 641500 863020 1423100 1422200 www.starindiaresearch.com
Weekly Newsletters Page 4 ; Most Active Bank Nifty option Scrip Strike price Option type Open Interest Bank Nifty 27500 CE 695160 Bank Nifty 27300 CE 504220 Bank Nifty 27000 PE 399620 Weekly FII DII FII RS CRORE NET DATE GROSS PURCHASE GROSS SALE PURCHASE/SALE 01-Feb-19 31-Jan-19 30-Jan-19 29-Jan-19 28-Jan-19 7,118.42 10,962.01 6,581.86 5,958.38 6,678.52 DII RS CRORE 5,802.53 7,955.60 6,451.61 6,312.74 6,455.08 1,315.89 3,006.41 130.25 -354.36 223.44 NET DATE GROSS PURCHASE GROSS SALE PURCHASE/SALE 01-Feb-19 31-Jan-19 30-Jan-19 29-Jan-19 28-Jan-19 4,024.98 5,751.35 4,715.38 3,740.77 3,717.26 4,030.05 7,385.67 4,213.12 3,659.50 3,624.94 -5.07 -1,634.32 502.26 81.27 92.32 www.starindiaresearch.com
Weekly Newsletters Page 5 ; SECTOR SCAN Sector Automotive % Chg 2.56% -0.25% -0.19% 0.94% 0.33% 1.51% 1.58% 0.63% 1.10% 1.08% -0.13% -2.39% -2.78% 0.32% 1.04% 0.87% 1.97% 0.31% 0.90% 0.79% 0.41% Sectoral Indices: Advance 51 90 39 42 17 6 18 53 26 48 72 18 29 73 9 40 33 35 13 3 10 Decline 28 95 48 61 11 4 9 72 49 51 120 25 54 86 12 42 17 43 14 2 13 Banking & Financial Services Cement & Construction Chemicals Conglomerates Consumer Durables Consumer Non-durables Engineering & Capital Goods Food & Beverages Information Technology Manufacturing Media & Entertainment Metals & Mining Miscellaneous Oil & Gas Pharmaceuticals Retail & Real Estate Services Telecommunication Tobacco Utilities Name NIFTY BANK NIFTY AUTO NIFTY FIN SERVICE NIFTY FMCG NIFTY IT NIFTY MEDIA NIFTY METAL NIFTY PHARMA NIFTY PSU BANK NIFTY PVT BANK NIFTY REALTY %change -0.77 2.71 0.04 1.34 1.45 -3.5 -3.44 1.63 -3.12 -0.73 1.25 www.starindiaresearch.com
Weekly Newsletters Page 6 ; NEWS CORNER 1.Reported Consolidated quarterly numbers for Berger Paints India are Net Sales at Rs 1,616.70 crore in December 2018 up 20.77% from Rs. 1,338.63 crore in December 2017. Quarterly Net Profit at Rs. 133.85 crore in December 2018 up 2.65% from Rs. 130.39 crore in December 2017. EBITDA stands at Rs. 251.13 crore in December 2018 up 7.95% from Rs. 232.64 crore in December 2017. 2.The Reserve Bank of India said that Bank of India, Bank of Maharashtra and Oriental Bank of Commerce were allowed to exit the prompt corrective action framework after meeting the regulatory norms. 3.Dr Reddys Labs Consolidated December 2018 Net Sales at Rs 3,864.60 crore, up 0.8% Y-o-Y Net Sales at Rs 3,864.60 crore in December 2018 up 0.8% from Rs. 3,834.10 crore in December 2017. Quarterly Net Profit at Rs. 500.30 crore in December 2018 up 65.28% from Rs. 302.70 crore in December 2017. EBITDA stands at Rs. 906.90 crore in December 2018 up 8.52% from Rs. 835.70 crore in December 2017. 4.Titan Company Consolidated December 2018 Net Sales at Rs 5,871.49 crore, up 37.35% Y-o- Y Net Sales at Rs 5,871.49 crore in December 2018 up 37.35% from Rs. 4,274.84 crore in December 2017. Quarterly Net Profit at Rs. 413.19 crore in December 2018 up 46.72% from Rs. 281.61 crore in December 2017. EBITDA stands at Rs. 653.82 crore in December 2018 up 47.34% from Rs. 443.74 crore in December 2017. 5.Leading jewellery exporter Rajesh Exports on Friday reported a 4.78 percent rise in consolidated net profit at Rs 315.96 crore for the quarter ended December 31, 2018. The company had reported a net profit of Rs 301.52 crore in the year-ago period. Rajesh Exports' total income from operations rose to Rs 44,026.02 crore during the third quarter under review, up 6.57 percent, from Rs 41,308.92 crore in the corresponding period of the previous year. 6.Jubilant Life Consolidated December 2018 Net Sales at Rs 2,377.10 crore, up 14.96% Y-o-Y. Net Sales at Rs 2,377.10 crore in December 2018 up 14.96% from Rs. 2,067.76 crore in December 2017. Quarterly Net Profit at Rs. 260.84 crore in December 2018 up 22.55% from Rs. 212.84 crore in December 2017. EBITDA stands at Rs. 522.28 crore in December 2018 up 24.33% from Rs. 420.06 crore in December 2017. 7.Punjab National Bank increased MCLR across various tenors by 5bps. One month MCLR at 8.20% and one-year MCLR was at 8.55%. 8.Oriental Bank of Commerce received Rs1,186cr capital infusion from government of India. The bank said that the amount was utilized to make loan loss provision in order to bring down the net NPA ration below the threshold under Prompt Corrective framework. www.starindiaresearch.com
Weekly Newsletters Page 7 ; STOCK OUTLOOK JUBLFOOD FUT :- Stock is trading higher since last couple of sessions and able to give breakouts of trend line and approached the resistance level as shown in chart. The stock is expected to give breakout ahead. Stock performance VWAP 771.89 8192000 23418.40 750 1372 1175.20 Traded Volume Traded Value (lacs) Market Lot Weekly High Weekly Low Rating Matrix by Researcher Rating R1/R2 S1/S2 LEVEL BUY 1430/1500 1245/1160 1376 Stock in ban period IDBI. www.starindiaresearch.com
Weekly Newsletters Page 8 ; DISCLAIMER Entering our site means that you have read, understood and agreed to everything that is written and implied in this disclaimer note. RESEARCH is published solely for informational purposes and must in no way be construed as investment advice for a specific individual. The information and views in this website & all the services we provide are believed to be reliable, but we do not accept any responsibility (or liability) for errors of fact or opinion. Users have the right to choose the product/s that suits them the most. Investment in equity shares, futures, options and commodities has its own risks. Sincere efforts have been made to present the right investment perspective. The information contained herein is based on analysis and on sources that we consider reliable. We, however, do not vouch for the accuracy or the completeness thereof. This material is for personal information and we are not responsible for any loss incurred due to it & take no responsibility whatsoever for any financial profits or loss which may arise from the recommendations above. The information contained herein is from sources believed reliable. We do not represent that it is accurate, complete and it should not be relied upon as such. Any action taken by you on the basis of the information contained in this site is your responsibility only and we will not be liable in any manner for the consequences of such action taken by you. Our Clients (Paid or Unpaid), any third party or anyone else have no rights to forward or share our calls or SMS or Reports or any other information provided by us to/with anyone which is received directly or indirectly by them. If found so then Serious Legal Actions can be taken. By accessing our site or any of its associate/group sites, you have read, understood and agree to be legally bound by the terms of the following disclaimer and user agreement Star India Market Research and its owners/affiliates are not liable for damages caused by any performance, failure of performance, error, omission, interruption, deletion, defect, delay in transmission or operations, computer virus, communications line failure, and unauthorized access to the personal accounts. Research House is not responsible for any technical failure or malfunction of the software or delays of any kind. We are also not responsible for non- receipt of registration details or e-mails. You understand and agree that no joint venture, partnership, employment or agency relationship exists between you and Research House as a result of this agreement or on account of use of our website. Price and availability of products and services offered on the site are subject to change without prior notice. We provide information about the availability of products or services to a certain extent but you should not rely on such information. Star India will not be liable for any lack of availability of products and services you may order through the site. www.starindiaresearch.com