Download
1 / 81
810 likes | 977 Vues
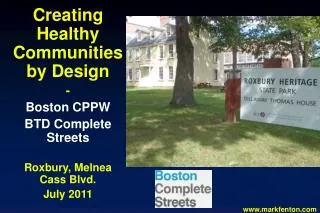
CPPW Action Institute San Diego, CA Place. May 28, 2010 Michael Moule National Complete Streets Coalition. 1. CPPW Action Institute Washington, DC, June 4, 2010 Barbara McCann National Complete Streets Coalition. 2. 2. CPPW Action Institute St. Louis, June 10, 2010 Roger Henderson

E N D
CPPW Action Institute San Diego, CA Place. May 28, 2010 Michael Moule National Complete Streets Coalition 1
CPPW Action Institute Washington, DC, June 4, 2010 Barbara McCann National Complete Streets Coalition 2 2
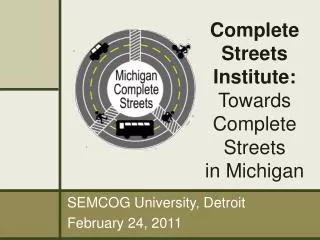
CPPW Action Institute St. Louis, June 10, 2010 Roger Henderson National Complete Streets Coalition 3 3
Yet many roads are built like this Recently completed IL 64 expansion with destinations on both sides of the road. Can you spot the pedestrian? 5
Or this: 6
What is a Complete Street? A Complete Street is safe, comfortable & convenient for travel via automobile, foot, bicycle, & transit 7
A Complete Streets Policy A complete streets policy ensures that the entire right of way is planned, designed, and operated to provide safe access for all users, including pedestrians, bicyclists, and transit users as well as children, older adults, and people with disabilities. Sacramento Area Council of Governments – Urban Advantage
The Growing Movement Number of Policies Adopted Year
Complete Streets Policies US Jurisdictions with Policies: 133 Policies Adopted Since 2005: 110 Policies in 2009: 42 As of 01/15/10 10
Why have a complete streets policy? To make the needs of all users the default for everyday transportation planning, design, construction and operations practices
Why have a complete streets policy? To provide transportation planners & engineers with political and community support for innovative solutions that help make active living possible. 12 NYC DOT
Who wants Complete Streets? Most Americans would rather drive less & walk more Transit is growing faster than population or driving About one-third of Americans don’t drive: 21% of Americans over 65 Children under 16 Low income Americans can’t afford to drive 13
Benefits: health • Now Americans move without moving • 60% are at risk for diseases associated with inactivity: • Obesity • Diabetes • High blood pressure • Other chronic diseases 14
White House Task Force on Childhood Obesity • “A complete network of safe bicycle and pedestrian facilities would allow children to take more trips through active transportation and get more physical activity. New Federal aid construction projects should accommodate bicyclists and pedestrians by incorporating “Complete Streets” principles.”
CDC Recommendations for Improving Health through Transportation Policy “… develop and implement model transportation and land use planning policies that encourage transit-oriented and mixed-use developments. Encourage: • Dense networks of connected streets which serve the needs of all transportation modes; for example, adopting measures such as “complete streets””
Benefits: Health Obesity is lower in places where people use bicycles, public transportation, and their feet. Pucher, “Walking and Cycling: Path to Improved Public Health,” Fit City Conference, NYC, June 2009
Benefits: safety Sidewalks reduce ped crashes 88% Medians reduce crashes 40% Road diets reduce crashes 29% Countdown signals reduce crashes 25% 18
Providing Access to Healthy Activity Residents are 65% more likely to walk in a neighborhood with sidewalks. Cities with more bike lanes per square mile have higher levels of bicycle commuting.
Access: Completing networks • Complete streets and trails can form a comprehensive non-motorized network • Complete streets make transit work better
Benefits: Less need to widen roads Trips in metro areas: • 50% - less than 3 miles • 28% - less than 1 mile: • 65% of trips under 1 mile are now taken by car 23
Types of Policy n=130 As of 01/25/10 26
Types of Jurisdictions n=119 As of 01/15/10 27
An ideal complete streets policy Sets a vision Includes all forms of travel Emphasizes connectivity Applies to all transportation projects & phases Specifies and limits exceptions, with management approval required Uses latest design standards & is flexible Is context-sensitive Sets performance standards Includes implementation steps 28
Vision: Decatur Community Trans Plan “To create a safe and efficient transportation system that promotes the health and mobility of Decatur citizens and visitors, creating better access to businesses and neighborhoods.” 29
Charlotte NC Transportation Action Plan “The City will promote a balanced and multi-modal transportation system that serves the mobility needs of all segments of the population, accommodates all travel modes and promotes community economic development needs.”
Reversed burdenof proof assumes sidewalks, bikeways, transit… … with exceptions: No expected users = no need, even in the future Costs disproportionately high relative to need, or Other factors indicate no need, even in the future No sidewalks needed Slow speed, no need for bike lanes 31
Complete Streets is NOT: • A design prescription • A mandate for immediate retrofit • A silver bullet; other initiatives must be addressed: • Land use (proximity, mixed-use) • Encouragement & Education • Enforcement • (but complete streets will help!) 32 32
Creating and Supporting an ideal complete streets policy: Establish high-level policy and vision Create an implementationplan Create clear goals and ways to measure progress toward those goals (measure bike/ped/transit travel!) Adjust project criteria and procedures to reward the achievement of complete streets goals 33
Implementation: From Policy to Practice An effective policy should prompt these changes: Restructure procedures Retrain planners and engineers Rewrite design manuals Develop new performance measures 36
3. Rewrite design manuals Mass. Project Development & Design Guide 3 guiding principles: Multimodal Consideration Context Sensitive Design A Clear Project Development Process
What should the street do? • We need to ask for more than • More pavement • More capacity What else could we measureon a street project? 41
Sample Measures • Reduced speed • Reduced crashes • Increase on-street parking use • Increase walking • Increase bicycling • Decrease noise • Increase neighborhood and business satisfaction
Case study: Edgewater Drive (Orlando FL) Resurfacing Project • Repaving project scheduled in FDOT 5-year work plan • FDOT open to 3-lane option if City takes over jurisdiction • Changes must be accepted by neighborhood and business associations; city must conduct before/after studies Before Concept
Before/after studies: 1. Crash rate 34% Reduction 1 crash every 2.5 days 1 crash every 4.2 days (146 per yr) (87 per yr) 46
68% Reduction Before/after studies: 2. Injury rate 1 injury every 9 days 1 injury every 30 days (41 per yr) (12 per yr) 47
Before/after studies: 4. Traffic volumes Now 21,000+ 49
23% Increase Before/after studies: 6. Pedestrian volumes 50