Download
1 / 29
290 likes | 526 Vues
Phosphorus Removal at Sand Creek Water Reuse Facility. presented at the 2006 Water Reuse Workshop Co-sponsored by RMSAWWA, RMWEA, and the Water Reuse Association Thursday, August 10th, 2006 Colorado School of Mines – Golden, Colorado. by Duane “Bear” Steib and Kathy Bill/City of Aurora

E N D
Phosphorus Removal at Sand Creek Water Reuse Facility presented at the 2006 Water Reuse Workshop Co-sponsored by RMSAWWA, RMWEA, and the Water Reuse Association Thursday, August 10th, 2006 Colorado School of Mines – Golden, Colorado by Duane “Bear” Steib and Kathy Bill/City of Aurora Steve Polson/CH2M HILL
Purpose of Study Determine the advanced phosphorus removal capabilities of the Sand Creek Water Reuse Facility
Treatment Facility • Primary clarification • Activated sludge • Nutrient (N and P) removal • Filtration • UV disinfection • Ferric chloride addition (available) • Polymer addition (available)
3650 diffusion heads Biological Nutrient Removal Basin 3 Aerobic Cells 3864 diffusers Anoxic Cell Anerobic Cell Anoxic Cell
DynaSand Filters Backwash Waste Filtered Effluent Upflow, Continuous Backwash Filter Filter Media (sand) Filtered Influent
Trojan 3000 Ultraviolet System 864 Low Pressure Low Intensity Bulbs
Design Criteria • Plant capacity: 5.0 mgd • Secondary effluent TP: 0.5 - 1.0 mg/L • Tertiary effluent TP: 0.2 mg/L limit (anticipated) • Discharge to Sand Creek: • BOD5/TSS 30 mg/L each (monthly) • Fecal coliform 2,000 mpn/100 mL (monthly) • Ammonia Driven by WET requirements
Design Criteria (cont) • Reuse quality: • BOD/TSS 5 mg/L each (monthly) • Total coliform 2.2 org/100 mL (7-day) • Turbidity 2 NTU (daily) • Requirements are different now: • E. coli 126 org/100 mL • Turbidity 3.0 NTU • Phosphorus not currently regulated
Year Plant Influent TP Primary Effluent TP Plant Effluent TP Plant Effluent TSS 2002 5.17 4.68 0.27 2.62 2003 5.76 4.93 0.24 1.71 2004 5.98 5.26 0.13 1.50 Why Mess With Near Perfection? Leading up to the study, the Sand Creek WRF consistently produced an effluent with a total phosphorus (TP) concentration of 0.10 – 0.20 mg/L. These low levels were achieved utilizing a very efficient biological nutrient removal process. Analysis in mg/L:
Goal of Study -- Determine the Limits of Tertiary P-Removal at the Sand Creek WRF • Design target: 0.10-0.12 mg/L (0.2 mg/L limit) “Metal salt addition followed by effluent filtration has been used successfully to meet monthly average effluent discharge standards of approximately 0.20 mg P/L.” (Phosphorus and Nitrogen Removal from Municipal Wastewater -- Principles and Practice, Richard Sedlak, Editor, 1991) • Study goal: 0.05 mg/L
BNR System Treats Nitrogen and Phosphorus Johannesburg Process Secondary Clarifier BNR Reactor MLR PE Anoxic Anaerobic Anoxic Aerobic SE RAS P-Release Denitrification Carbon Oxidation Denitrification Nitrification PhosphorusUptake WAS RAS
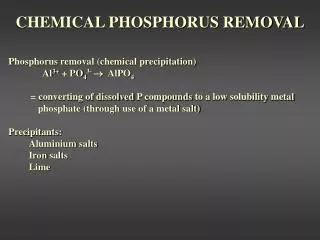
Chemical-P Removal Alternatives • Capability to add metal salts at several locations • Primary clarifier influent • Secondary clarifier influent • Secondary clarifier effluent • Multiple-point chemical addition – add at several locations • Alum or ferric chloride can be used • Ferric used to comply with Metro Denver request
First Steps in the AWT Process are Chemical Addition and Flocculation • Chemicals added at the rapid mix chamber • Flocculation occurs in the filter influent flow distribution structure
Filtration and Disinfection Follow... • Next, the flocculated water flows through four DynaSand filters to remove the precipitate formed • The filters are mono-media, deep bed, upflow, continuous backwash type • The sand size is 1 mm and the sand depth is 80” • The filtration rate is 3.5 gal/min/ft2 • The filtered water then flows through two UV disinfection channels
The Pilot Project Plan • Determine the types of phosphorus in the secondary effluent • Bench studies – jar tests • Full scale pilot test
Analytical Method Used to Determine Types of Phosphorus in the Secondary Effluent • Analysis determined soluble and insoluble forms for total, polyphosphate and ortho phosphate using Hach equipment and methods • Procedures used to ensure the validity of results including dedicated acid washed glassware, reagent blanks, standards and splits with QC laboratory
Bench Studies Method – Jar Tests • Set up to simulate operations from the rapid mix to the filter effluent • Chemicals used were ferric chloride and anionic polymers • Analysis on secondary effluent and simulated filter effluent included phosphorus, alkalinity, pH, turbidity and iron residual
Bench Studies Results • 20 – 40 % reduction in total phosphorus noted • Little or no effect on pH and alkalinity • Turbidity increased and iron residual present
Full-Scale Pilot Test Method (Objectives) • Feed chemicals at the AWT to reduce the total phosphorus in the plant effluent to 0.05 mg/L • Determine the effect of chemical treatment on the plant effluent • Feed chemical doses at reasonable doses that will not the negatively impact AWT equipment and filter media
Conclusions • Bench and full-scale pilot testing did reduce the total phosphorus, however in this study the target level of 0.05 mg/L was not reached.
Conclusions (cont) • Experience at Sand Creek was similar to that at other advanced P-removal facilities: • Achieving a reliable effluent TP less than 0.1 mg/L was not feasible using ferric chloride and direct filtration • Lower concentrations would require major process modifications • Increased chemical feed • Flocculation/sedimentation + filtration • Membranes