Download
1 / 11
110 likes | 225 Vues
Detailed analysis of fish ladder operations at Bonneville Dam, including flow measurements, deployment sketches, and TDG saturations. Photographs document the south and north fish ladders. Data captured on April 4, 2006.

E N D
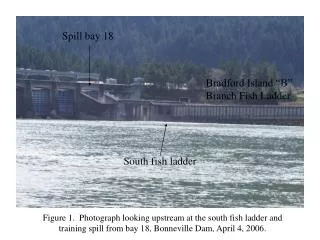
Spill bay 18 Bradford Island “B” Branch Fish Ladder South fish ladder Figure 1. Photograph looking upstream at the south fish ladder and training spill from bay 18, Bonneville Dam, April 4, 2006.
Spill bay 1 Cascade Island North fish ladder Figure 2. Photograph looking upstream at the north fish ladder and training spill from bay 1, Bonneville Dam, April 4, 2006.
Figure 3. TDG pressure and project operations measured at the Bonneville Dam forebay and tailwater fixed monitoring stations, April 4, 2006.
B A Figure 5. Photograph of the entrance of the south fish ladder (positions A and B), Bonneville Dam, April 4, 2006.
Figure 6. TDG pressure and instrument depth measured at the Bonneville Dam south fish ladder, April 4, 2006.
Figure 7. TDG saturations and instrument depth measured at the Bonneville Dam south fish ladder, April 4, 2006.
E D F Figure 8. North fish ladder deployment sketch
Figure 9. TDG pressure and instrument depth measured at the Bonneville Dam north fish ladder, April 4, 2006.
Figure 10. TDG saturations and instrument depth measured at the Bonneville Dam north fish ladder, April 4, 2006.
F E Figure 11. Photograph of the north fish ladder (positions E and F), Bonneville Dam, April 4, 2006.