4 300
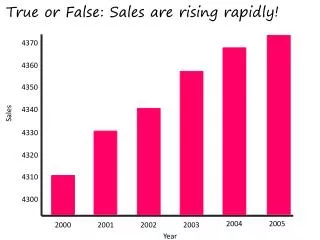
True or False: Sales are rising rapidly!. 4370. 4360. 4350. 4340. Sales. 4 330. 4320. 4310. 4 300. 2004. 2005. 2000. 2001. 2002. 2003. Year. True or False: There are more 15 year old boys than girls. . Girls. Boys. 18 year olds. 18 year olds. 15 year olds. 15 year olds.

4 300
E N D
Presentation Transcript
True or False: Sales are rising rapidly! 4370 4360 4350 4340 Sales 4330 4320 4310 4300 2004 2005 2000 2001 2002 2003 Year
True or False:There are more 15 year old boys than girls. Girls Boys 18 year olds 18 year olds 15 year olds 15 year olds 17 year olds 17 year olds 16 year olds 16 year olds
True or False: Twice as many people like Thriller’s than Romance films. 150 120 100 60 Number of People 40 25 20 5 Action Thriller Horror Romance Comedy Favourite Films
True or False: Most people took between 20 and 60 minutes to get to work 40 35 30 25 Number of Employees 20 15 10 5 0 30 60 10 20 90 40 50 70 80 Time to Travel To Work
Time Taken To Travel to Work 0 < x < 10 minutes 10 < x < 20 minutes 20 < x < 60 minutes 60 < x < 90 minutes
Histogram with Unequal Bars: Area Represents Frequency. 4 3.5 3 2.5 Frequency Density 2 1.5 1 0.5 0 30 60 10 20 90 40 50 70 80 Time to Travel To Work
Speed of Cars on Motorway Speed (km/h) No. Cars 0 < x < 20 10 40 20 < x < 30 30 < x < 70 50 70 < x < 80 20 Draw a histogram to represent this data.
How did you do? 4 3.5 3 2.5 Frequency Density 2 1.5 1 0.5 0 30 60 10 20 90 40 50 70 80 Speed of Travel