Download
1 / 24
240 likes | 359 Vues
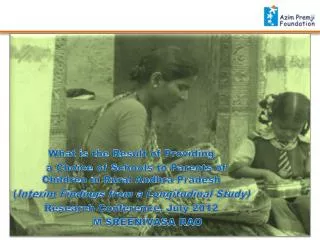
What is the Result of Providing a Choice of Schools to Parents of Children in Rural Andhra Pradesh ( Interim Findings from a Longitudinal Study) Research Conference, July 2012 M SREENIVASA RAO. AP School Choice Study.

E N D
What is the Result of Providing a Choice of Schools to Parents of Children in Rural Andhra Pradesh (Interim Findings from a Longitudinal Study) Research Conference, July 2012 M SREENIVASA RAO
AP School Choice Study • Study in partnership with Government of Andhra Pradesh and Legatum Foundation • The technical support provided by Dr. Karthik Muralidharan, Assistant Professor, University of California, San Diego Sandiego. • Started in 2007 – 08 and scheduled to run till 2012 – 13 • Findings are preliminary (after three years of the study). Hence need to view with caution. • Findings not meant for wider circulation or citation at this point.
Quality of education is a major concern Access has certainly improved but what about quality? Large scale assessment work by Azim Premji Foundation in several states indicates • Learning achievement levels poor in all grades and most learning is rote memory based and not on conceptual • Studies in Andhra Pradesh show mechanical learning is more than conceptual learning (other large scale project under AP RESt) ASER reports suggest (All India) 40% of class 3 children can only read simple words (class 1 level) Only three out of ten class 5 children can read class 3 text well 75% of class 3 children can do one digit additions BUT less than 20% can solve a one digit addition word problem
Private Schooling has increased • Proliferation of Private schools in- spite of various government efforts (SSA, RMSA etc..) in the last decade • 6-14 yrs of children attending private schools
RtE Provisions on Equity The Right to Education Bill 2005 is the latest effort by the government and education experts to bring elementary education to all. The Bill provides that children between the ages of six and 14 years have the right to free and compulsory education in a neighbourhood school. The government shall ensure that all children have this right including inclusive education. Section 12 of the Right of Children to Free and Compulsory Education Act 2009 (the Act) has made it compulsory for every private unaided school to admit at least 25% of its entry level class from children belonging to weaker and disadvantaged groups. For this category of students the state government shall reimburse schools an amount equal to either the fees charged by the school or the per child expenditure in state schools, whichever is lower Will RtE succeed in achieving quality education for all?
Genesis of the Study • Parents are very keen to provide good education to their children • Most parents of government school children are unhappy with the school • Private schools ‘seem’ to provide better learning Do private schools really add value to all children? Is the difference on account of school inputs or other factors?
Objectives of the Study (mimic of the RtE key Act) To rigorously evaluate the impact of providing school choice to disadvantaged children in rural areas of Andhra Pradesh, both on children who receive the choice as well as the aggregate impact on education outcomes for all children in villages where the school choice program is implemented To disseminate the results of the impact evaluation of the school choice program to inform primary education policy in AP, India, and beyond.
School Choice: Time Line Year 1: 2008-09; Year 2: 2009-10; Year 3: 2010-11; Year 4: 2011-12
Study Design • Longitudinal 5 year research study • Randomized evaluation design
Key Features of Scholarship Program Household level • Completely voluntary, can always go back to public school • No conditions (except answering surveys and taking assessments) • Scholarship covered all school fees, books, and uniforms • Did not cover transport and mid-day meals • Household did not see any cash (payments made directly to schools) School level • Completely voluntary as well • Fees set by Foundation at the 90th percentile of the distribution of private school fees in the sample villages (expected to be above marginal cost for all schools) • Pre-specified rate of fee increase for 5 years (based on inflation) with an average annual increase of ~10-12% Schools were asked if they: 1. Wanted to participate in the program • And if so, how many seats they could offer to scholarship students • Schools not allowed to cherry pick students – if there was more demand for a particular school than the number of places offered under (B), then those places would be allocated by lottery • Fees would be directly paid by the Foundation (including books, and uniforms) • No top up fees could be charged (except for the school bus if used)
Scholarship Eligibility and Process • Eligibility for the scholarship: • Not currently attending a private school • Participated in the baseline assessment and also provided info on Household Scholarship Allotment • Parents’ of the children in class 1 in government schools and Class 0 of Anganwadis in experimental villages, given an option (Scholarship) to send their children to private recognized school of their choice within the village. • Communication to Private schools • Private recognized schools, from both control and treatment villages, informed of the provisions of the project and asked to sign a consent form to participate in the study. • After allotment of the villages to Control and Treatment, interested private schools signed an agreement with the foundation. Transparency in process helped in acceptance of the project
Summary of the Scholarship Details • 68% parents finally accepted and moved to Private schools • 22% of the children withdrew from the program over 3.5 years
Summary Statistics on Public & Private Schools (in our sample) - Significant differences in household profile - Pvt school students from relatively better socio-economic house- holds with better parental education * Household asset index constructed based on Ownership, type, number of rooms, water and toilet
School Characteristics Significant difference in facilities as well
Profile of Teachers Significant difference in the profile of teachers in Government Schools
Learning Achievement (Preliminary results) • Performance of scholarship students worse than those who stayed back in govt schools • Scholarship students better in English subject than govt school students • Children who moved to English medium schools are doing worse than Telugu medium school going children • Clear mismatch in parents’ opinions and students’ performance?
Scholarship Parents’ feedback on school What makes parents of scholarship children happy?
Scholarship Parents’ feedback on children‘s activities Responses mainly centeredaround ‘visible’ indicators
Summary and conclusion – I • Scholarship students in private schools, interestingly have performed worse than their corresponding counterparts in government schools • Parents’ feed back on pvt. schooling is however very positive • The mismatch could be because - parents are evaluating school outcomes on softer factors like uniforms, discipline, attendance in school (both of children and teachers) etc. - parents are not fully aware of the differences in learning levels - the scholarship students have not had two years of ‘pre-school’ • The learning levels gap between Private and Government school are insignificant, If control variables such as HH index, parental education and preprimary schooling • clearly a need to do further analysis and look at data over the next two years more carefully to understand these complex issues. • Results at this stage are very preliminary and not for circulation and citation
Summary and conclusion - II • Performance of regular students in private schools is significantly better (at 99% level of confidence) than students in government schools both in Telugu and Math's. • This could be largely on account of socio demographic factors • There is clear and significant differences in the profiles of the parents and households, the teachers and the school facilities between the private schools and government schools. Private schools - - students clearly have better socio-economic background - parents are relatively ‘better’ educated - have better facilities than govt schools on some parameters - teachers are less absent - but profile of pvt school teachers not as good as teachers in govt schools on parameters like experience, education, training
Time for Questions • Thank You • Questions Q&A Session