Download
1 / 11
130 likes | 178 Vues
Learn how constructed wetlands can effectively remove pathogens from water sources, reducing the risk of waterborne diseases. Studies show the impact of factors like turbidity, temperature, vegetation density, and wetland type on pathogen removal. Discover the importance of this ecological solution in safeguarding public health.

E N D
Constructed Wetlands and Pathogens By Stephanie Boone
Background • The cleanest oceans have 1.1x1029 prokaryotic cells and 7.5x10⁷ viruses per teaspoon. • Riverine wetland estimated plantonic viruses 3.8x10⁵ and surface viruses 1.3x10⁷ per ml.
Background • 2001 265 of deaths worldwide were caused by infectious disease. • Water-related diseases are leading cause of morbidity and mortality. • In the US between 1971 and 1994 there were 650 waterborne outbreaks and 569,754 cases of waterborne illness.
Background • Pathogens enter the groundwater supply through: • Sewage treatment effluents *Excretion of 1011 viral particles per gram of feces. • Onsite septic waste treatment discharges *traced viruses travel 328 ft. through groundwater • Leachates from sanitary landfills • Land runoff from urban, agricultural and natural areas. *58% waterborne outbreaks connected with groundwater. *33% associated with surface water.
Background Microorganisms known for disease transmission by water include; Giardia, Cryptosporidium, Legionella, E. Coli 0157 H7, rotavirus, hepatitis E, norovirus, Hepatitis A, poliovirus, adenovirus, astroviruses.
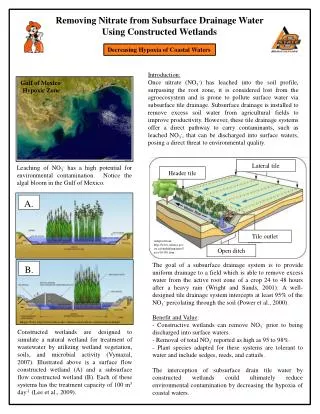
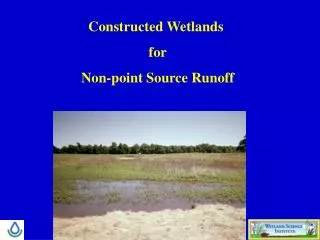
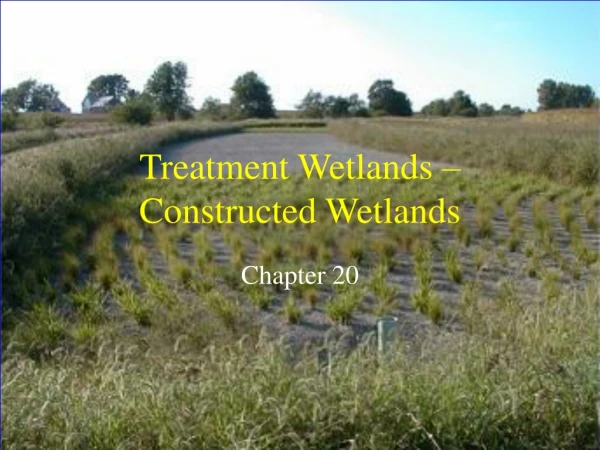
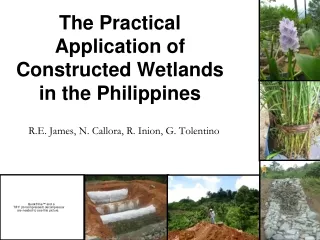
Wetlands remove pathogens through a combination of: Sedimentation Precipitation Absorption to soil particles Assimilation by plant tissue Microbial transformation Studies indicate that pathogen removal can be effected by: Turbidity Temperature The presence of vegetation Wetland type (subsurface or surface) Constructed Wetland Removal of Pathogens
Constructed Wetland Studies • Turbidity • Higher turbidity decreases viral removal and increases parasite removal. • Blocks UV light. • Temperature • Increase temperature increases viral removal. • Varies depending on parasite.
Constructed Wetland Studies • Vegetation • Increase in vegetation density leads to increase in viral removal. • Effect on parasite removal ???. • Dense vegetation facilitates sedimentation, sorption straining and other decay process. • Plants can damage enteric pathogens by excreting toxic antimicrobial substances from roots.
Type of Wetland • Subsurface flow removed 95% of coliphage and 99% of Polio virus as compared with 40% removal in a duckweed pond. • Duckweed pond removed 89% - 98% of Giardia and Cryptosporidium as compared to 58%-73% in a surface wetland.
Conclusions • Generally factors that decrease heat and UV light have a negative effect on pathogenic virus removal. • Parasites are generally removed by sedimentation and removal factors vary depending on parasite. • Combination of filtration or removal sources are best to insure maximum pathogen removal.