Download
1 / 12
120 likes | 238 Vues
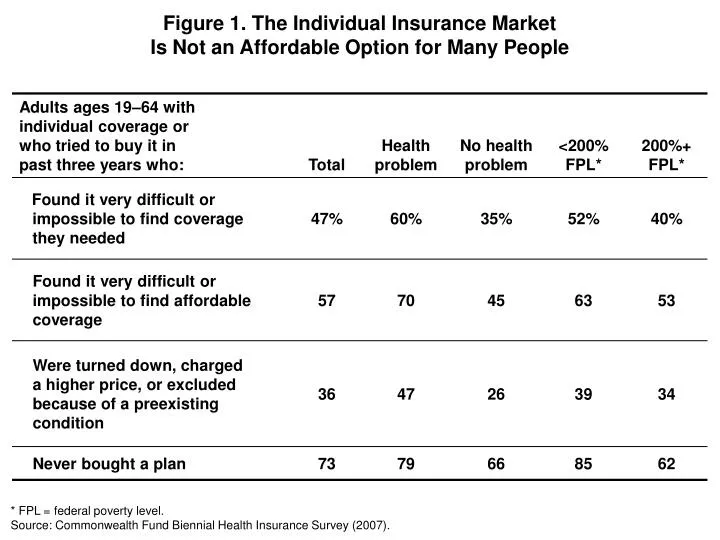
Figure 1. The Individual Insurance Market Is Not an Affordable Option for Many People. * FPL = federal poverty level. Source: Commonwealth Fund Biennial Health Insurance Survey (2007).

E N D
Figure 1. The Individual Insurance MarketIs Not an Affordable Option for Many People * FPL = federal poverty level. Source: Commonwealth Fund Biennial Health Insurance Survey (2007).
Figure 2. More than Three of Five Adults with Individual Market Coverage Have Annual Premium Costs of $3,000 or More, 2007 Percent of privately insured adults ages 19–64 64 23 20 Note: Adults continuously insured all year with employer-sponsored insurance or individual insurance. Source: Commonwealth Fund Biennial Health Insurance Survey (2007).
Figure 3. Deductibles, Premium Costs, and Out-of-Pocket SpendingAre Higher for Adults with Individual Insurance, 2007 Percent of privately insured adults ages 19–64 * Out-of-pocket costs include all medical expenses, premiums, and prescription drug spending. Note: Adults continuously insured all year with employer-sponsored insurance or individual insurance. Source: Commonwealth Fund Biennial Health Insurance Survey (2007).
Figure 4. The Share of Adults with High Deductibles Increased Between 2003 and 2007 Percent of privately insured adults ages 19–64 with deductibles of $1,000 or more Note: Adults continuously insured all year with employer-sponsored insurance or individual insurance. Source: Commonwealth Fund Biennial Health Insurance Surveys (2003, 2005, and 2007).
Figure 5. More Privately Insured Adults Are Spending Large Amountsof Income on Out-of-Pocket Costs and Premiums, 2001–2007 Percent of privately insured adults ages 19–64 with high out-of-pocket costs and premiums Out-of-Pocket Costs Equal5% or More of Household Income Out-of-PocketCosts Equal10% or More of Household Income Notes: Family out-of-pocket costs include all medical expenses, premiums, and prescription drug spending. Adults continuously insured all year with employer-sponsored insurance or individual insurance. Source: Commonwealth Fund Biennial Health Insurance Surveys (2001 and 2007).
Figure 6. Adults with Higher Deductibles Are More Likely to Spend $1,000 or More on Family Out-of-Pocket Expenses, 2007 Percent of privately insured adults ages 19–64 69 63 48 43 Annual Deductible Notes: Family out-of-pocket expenses include out-of-pocket spending on medical care, prescription drugs, and dental and vision care. Does not include premium costs. Numbers may not sum because of rounding. Adults continuously insured all year with employer-sponsored insurance or individual insurance. Source: Commonwealth Fund Biennial Health Insurance Survey (2007).
Figure 7. Increasing Shares of Adults Across the Income ScaleAre Spending Large Amounts of Incomeon Out-of-Pocket Costs and Premiums, 2001–2007 Percent of privately insured adults ages 19–64 with high out-of-pocket costs and premiums Out-of-Pocket Costs Equal 5% or More of Household Income Out-of-PocketCosts Equal 10% or More of Household Income Notes: Family out-of-pocket costs include all medical expenses, premiums, and prescription drug spending. Adults continuously insured all year with employer-sponsored insurance or individual insurance. FPL = Federal Poverty Level. Source: Commonwealth Fund Biennial Health Insurance Surveys (2001 and 2007).
Figure 8. Since 2003, Increasing Shares of Privately Insured Adults Are Underinsured Percent of privately insured adults ages 19–64 who are underinsured Notes: Underinsured defined as insured all year but experienced one of the following: medical expenses equaled 10% or more of income; medical expenses equaled 5% or more of income if low-income (<200% of poverty); or deductibles equaled 5% or more of income. Adults continuously insured all year with employer-sponsored insurance or individual insurance. Source: Commonwealth Fund Biennial Health Insurance Surveys (2003 and 2007).
Figure 9. Individual Insurance Plans Are More Likely to Limit Benefits and Require Greater Cost-Sharing in 2007 Percent of privately insured adults ages 19–64 Note: Adults continuously insured all year with employer-sponsored insurance or individual insurance. Source: Commonwealth Fund Biennial Health Insurance Survey (2007).
Figure 10. One-Third of Privately Insured AdultsExperience Medical Bill or Debt Problems, 2005–2007 Percent of privately insured adults ages 19–64experiencing medical bill or debt problems* * Had problems paying medical bills, contacted by a collection agency for unpaid bills, had to change way of life in order to pay medical bills, or currently has medical bills being paid off over time. Note: Adults continuously insured all year with employer-sponsored insurance or individual insurance. Source: Commonwealth Fund Biennial Health Insurance Surveys (2005 and 2007).
Figure 11. The Share of Privately Insured Adults Experiencing Difficulty Accessing Health Care Increased from 2001 to 2007 Percent of privately insured adults ages 19–64who experienced any one of four access problems* * Access problems include not doing the following because of cost: did not fill a prescription; skipped a medical test, treatment, or follow-up recommended by a doctor; had a medical problem but did not go to doctor or clinic; or did not see a specialist when you or your doctor thought you needed one. Note: Adults continuously insured all year with employer-sponsored insurance or individual insurance. Source: Commonwealth Fund Biennial Health Insurance Surveys (2001 and 2007).
Figure 12. Adults with Individual Insurance Are Less ConfidentThey Will Be Able to Afford and Get High-Quality Care in the Future, 2007 Percent of privately insured adults ages 19–64 who are very confident that they will be able to afford needed medical care or get high-quality and safe medical care Note: Adults continuously insured all year with employer-sponsored insurance or individual insurance. Source: Commonwealth Fund Biennial Health Insurance Survey (2007).