Download
1 / 62
620 likes | 755 Vues
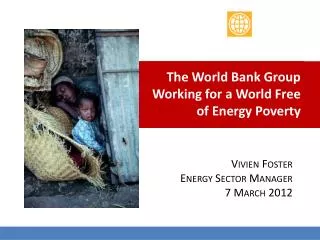
The World Bank Group Working for a World Free of Energy Poverty. Vivien Foster Energy Sector Manager 7 March 2012. AGENDA. Introducing the World Bank Group Global Energy Trends Highlights of WBG Energy Portfolio Spotlight on Africa Energy . Introducing The World Bank Group.

E N D
The World Bank GroupWorking for a World Free of Energy Poverty Vivien Foster Energy Sector Manager 7 March 2012
AGENDA • Introducing the World Bank Group • Global Energy Trends • Highlights of WBG Energy Portfolio • Spotlight on Africa Energy
Introducing The World Bank Group International Bank for Reconstruction and Development
Introducing The World Bank Group Early borrowers • First World Bank loan to France • $250 million (=$2.4 billion today) for Air France, purchase of oil and gas for thermal power stations • France, Germany, Japan, Denmark, Italy, Australia: once borrowers, now donors • More recent ‘graduates’: Slovak Republic (2008); Hungary (2007); Czech Republic (2005)
Evolving Priorities… 1950s: Physical1960s: Rural1970s: Human1980s: Financial1990s: Social2000s: Institutional2010’s Global Public Goods (Sustainable Energy, Combat Climate Change)
World Bank Group Agencies International Bank for Reconstruction & Development (1944) International Development Association (1960) International Finance Corporation (1956) Multilateral Investment Guarantee Agency (1988) International Center for the Settlement of Investment Disputes (1966)
Who Leads The World Bank? Shareholders 15.85% 6.84% 4% 4% 3.75% 3.75% 3% 3% 55%
In Which Sectors Do We Lend? • Law, Justice & Public Administration • Agriculture, Fishing, Forestry • Transport • Health, Education & Social Services • Water & Sanitation • Industry & Trade • Finance • Energy & Mining
Global Energy Trends Energy Access and Energy Poverty • 1.3 billion without access to electricity • 2.5 billion use biomass & coal for cooking & heating: nearly two million die per year. • Power shortages longer, more frequent & more widespread, limiting economic development & poverty reduction. • Without modern energy, factories and businesses—large and small—cannot function efficiently; hospitals and schools cannot operate fully or safely; basic services that people in rich countries take for granted cannot be offered.
Global Energy Trends Energy Poverty by Region
Global Energy Trends Balancing Access and Climate Change • Global temperature rise over 2⁰ C would cause major disruptions • ‘Business-as-usual’ scenarios would double energy-related CO2 emissions by 2050 • Energy generation, processing, and use contribute over 60% of the world’s greenhouse gas emissions • Developing countries, and especially poor people, are disproportionately affected by the impact of climate change
Global Energy Trends Managing Uncertainties • Oil price fluctuations highlight need to: • Diversify energy mix • Enhance energy efficiency • Be prepared for energy price volatility and shocks. • Financial crises have increased uncertainty in investments, while reducing development aid and investment flows.
Global Energy Trends Sustainable Energy for All • UN General Assembly in Dec 2010 declared 2012 the “International Year of Sustainable Energy for All.” • September 2011: Sustainable Energy for All Initiative sets three goals to be achieved by 2030: • Universal access to modern energy services • Double rate of energy efficiency improvement. • Double share of renewable energy.
Policies could radically alter long-term outlook World primary energy demand by scenario Current PoliciesScenario 20 000 Mtoe 18 000 New Policies Scenario 16 000 14 000 450 Scenario 12 000 10 000 8 000 6 000 1980 1990 2000 2010 2020 2030 2035 In the ‘New Policies Scenario’, demand increases by 40% between 2009 & 2035
Electricity demand rising World electricity supply and demand by sector in the New Policies Scenario 40 000 Own Use TWh 35 000 Transmission & distribution losses 30 000 Demand: Other 25 000 Transport 20 000 Services 15 000 10 000 Residential Industry 5 000 0 All sectors see higher demand for electricity, with non-OECD countries accounting for more than 80% of the increase between 2009 & 2035 2000 2005 2010 2015 2020 2025 2030 2035
Towards more diversified power generation Share of world electricity generation by fuel in the New Policies Scenario 2009 20 043 TWh 2020 27 881 TWh 2035 36 250 TWh 0% 20% 40% 60% 80% 100% Coal Gas Oil Nuclear Biomass Hydro Wind Other Coal remains largest source of electricity generation globally to 2035, growing by 45%, but its share of total generation drops from 41% to 33% in favour of gas & renewables.
Towards Cleaner Electricity Generation Electricity generation by selected low carbon technology & share of electricity generation by scenario, 2009 and 2035 100% 7 000 2009 TWh 6 000 80% Incremental to2035 over 2009: 5 000 60% New Policies Scenario 4 000 Share of electricity generation 3 000 40% 450 Scenario 2 000 20% 1 000 0% 0 Nuclear Hydro Wind Biomass SolarPV Other renew. CCS Low carbon Low-carbon generation
‘450 Scenario’: illustrates what 2⁰C goal requires World energy-related CO2 emissions by scenario OECD Non-OECD 45 Gt 28% Current Policies Scenario 71% 7 Gt 40 33% 35 New Policies Scenario 65% 30 15 Gt 25 450 Scenario 20 1990 2000 2010 2020 2030 2035 Restricting the greenhouse-gas concentration to 450 ppm would limit temperature increase to 2⁰C, compared with 3.5⁰C in the New Policies Scenario & 6⁰C in the Current Policies Scenario.
Efficiency gains can contribute most to emissions reductions World energy-related CO2 emissions abatement in the450 Scenario relative to the New Policies Scenario 38 Gt New Policies Scenario Abatement 36 2020 2035 34 Efficiency 72% 44% 32 Renewables 17% 21% 30 Biofuels 2% 4% 28 Nuclear 5% 9% 26 CCS 3% 22% Total (Gt CO2) 2.5 14.8 24 450 Scenario 22 20 2010 2015 2020 2025 2030 2035 • Energy efficiency measures – driven by strong policy action across all sectors – account for 50% of the cumulative CO2 abatement.
Universal access will not cost the earth 5.3 x more 2009 Energy for All Case 2010-2030 0 10 20 30 40 50 Billion dollars (2010) Investment needs to grow by more than five-times to $48 billion a year – equivalent to around 3% of global energy investment.
Where is the investment needed? Regional breakdown of the $48 billion investment required 6% Sub-Saharan Africa 21% India Other Asia 49% Other countries 24% Nearly half of the investment is needed in Sub-Saharan Africa.
All fuels have a role to play World energy-related CO2 emissions by scenario Mini-grid and off-grid electricity generation (470 TWh) On-grid electricity generation (368 TwH) 7% 34% 66% 93% A range of technical solutions using different sources of energy is required.
Implications of modern energy for all 20 40 Additional energy demand in the Energy for All Case 0.7% 1.1% Gigatonnes 15 30 Additional CO2 emissions in the Energy for All Case Billion tonnes of oil equivalent 10 20 5 10 0 0 World energy demand2030 World CO2 emissions 2030 Achieving modern energy for all would only have a negligible impact on energy demand at the global level & efforts to combat climate change
Modern energy brings health benefits Premature annual deaths from household air pollution and selected diseases 2.5 Million 2.0 1.5 1.0 0.5 0 2008 2030 2008 2030 2008 2030 2008 2030 Malaria Tuberculosis Smoke from biomass HIV/AIDS Clean cooking facilities would prevent the majority of deaths attributable to indoor air pollution from burning biomass.
Investment in energy projects with private participation in developing countries by region, 1990‒2010 Source: World Bank and PPIAF, PPI Project Database. * Adjusted by US CPI.
Investment in energy projects with private participation in developing countries by type of business, 1990‒2010 Source: World Bank and PPIAF, PPI Project Database. * Adjusted by US CPI.
Investment in energy projects with private participation in developing countries by main recipients, 1990‒2010 Source: World Bank and PPIAF, PPI Project Database. * Adjusted by US CPI.
Investment in energy projects with private participation in developing countries by type of PPI, 1990‒2010 Source: World Bank and PPIAF, PPI Project Database. * Adjusted by US CPI.
Top sponsors in PPI developing country energy projects 2005-10 Source: World Bank and PPIAF, PPI Project Database. * Nominal million of US$.
World Bank Financing • Total WBG energy lending: $41 billion since 2007 • Growth in RE & EE lending & policy support • Seek combination: RE/EE + expanding access • Relative decline in fossil fuels, but still 25% of portfolio • Emphasis on knowledge services, analytics & leveraging private finance • Sustainable Energy for All: three goals by 2030 • Rio+20
Bank portfolio in renewable energy IV WAY FORWARD • Renewable Energy has increased 350 percent from FY07 to FY11, reaching a peak of $3 billion in FY11 • 45% of the commitments is for hydropower, followed by multiple RE technologies (29%), 7% each for geothermal and solar PV • EAP accounts for the largest share of RE commitments (26%), followed by AFR (22%). Bank Financing in Renewable Energy FY07 to FY11
Low-Carbon Operations • Low Carbon financing hit a record high reaching $5.9 billion in FY10, a 76% increase from FY2009 • The number of low carbon projects increased from 111 in FY07 to 179 in FY11 • In FY11 low carbon share was 73%, compared to 43% in FY10 • The WBG is ahead of the commitment made for New RE and EE in the Development and Climate Change: A Strategic Framework for World Bank Group (DCCSF)
World Bank Group Financing For Energy 2007-11 (FISCAL YEARS)
Climate and Energy Trends and challenges • Climate risks increase energy constraints • Pressure mounts on water, land and food • Transformation in global energy markets underway • Structural shifts in financing to drive green growth • Policy/regulatory reform uneven & uncertain • RE is capital intensive • Country capacity, creditworthiness often weak
World Bank Group Role…… • Facilitate regional energy opportunities • Build credible regulation (transparent, principled, predictable over time and not politicized) • Improve governance and financial balance of power companies • Strengthen capacity and increase resources for preparation of a strong pipeline of bankable projects • Collectively adopt global standards for project implementation • Make electrification a national priority going beyond politics and drive it as a campaign • Exhort private sector, local civil society organizations and communities to step forward and join the campaign
Future Priorities • Policy/regulation fixes for incentives, certainty, performance • Innovation in technology, business models, and financing • Climate financing for capital and cost buy-downs • Government commitments and capacity building • Surgical use of institutional financing to de-risk projects and leverage private capital
Business Lines • Energy & Green Growth: low-carbon technologies, EE in service provision; transformative hydropower; EE cities; RE policy incentives • Energy Access & Poverty: grid & off-grid; household fuels • Governance & Sustainability in EI: transparency & accountability
Sustainable Energy Trust Funds
Oil, Gas & Mining: Priorities Work on Oil, Gas and Mining is aligned with the Bank’s Governance and Anti-Corruption (GAC) agenda. It supports sustainable management of natural resources along the entire value chain (EITI).
Projects: Bangladesh solar home systems Rural Electrification in Bangladesh • Rural Electrification and Renewable Energy Development (RERED) program launched in 2002 with WB support • 1.2 million solar home systems installed • Innovative financing schemes involving micro-credit institutions • Strict quality control of technical standards for the equipment • Streamlined follow-up maintenance • Focus on consumer awareness
Projects: Lao PDR - Nam Theun 2 • $153 million in WB IDA loans and guarantees + support from 26 other parties, including Electricité de France, helped build and operate hydropower facility providing 1000 MW of power for export to Thailand and an additional 75 MW for domestic consumption • Nam Theun 2 will deliver $2 billion in revenues for Lao PDR development over 20 years • Benefits for affected people include improved living conditions for 6,000 resettled villagers & programs for 200 villages downstream; improved road access, job opportunities & protection of biodiversity.