
Uploaded by
corina
10 SLIDES
320 VUES
100LIKES
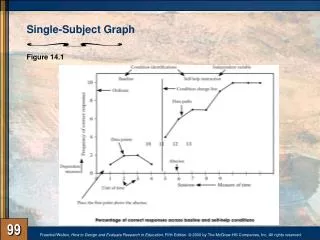
Single-Subject Graph
DESCRIPTION
Single-Subject Graph. Figure 14.1. 99. An A-B Design. Figure 14.2. 100. An A-B-A Design. Figure 14.3. 101. A B-A-B Design. Figure 14.5. 102. An A-B-C-B Design. Figure 14.6. 103. Illustration of Multiple-Baseline Design. Figure 14.8. 104.
Download
1 / 10
Télécharger la présentation 
Single-Subject Graph
An Image/Link below is provided (as is) to download presentation
Download Policy: Content on the Website is provided to you AS IS for your information and personal use and may not be sold / licensed / shared on other websites without getting consent from its author.
Content is provided to you AS IS for your information and personal use only.
Download presentation by click this link.
While downloading, if for some reason you are not able to download a presentation, the publisher may have deleted the file from their server.
During download, if you can't get a presentation, the file might be deleted by the publisher.
E N D
Presentation Transcript
Single-Subject Graph Figure 14.1 99
An A-B Design Figure 14.2 100
An A-B-A Design Figure 14.3 101
A B-A-B Design Figure 14.5 102
An A-B-C-B Design Figure 14.6 103
Illustration of Multiple-Baseline Design Figure 14.8 104
A Multiple-Baseline Design Applied to Different Settings Figure 14.9 105
Variations in Baseline Stability Figure 14.10 106
Differences in Degree and Speed of Change Figure 14.11 107
Differences in Return to Baseline Conditions Figure 14.12 108


More Related