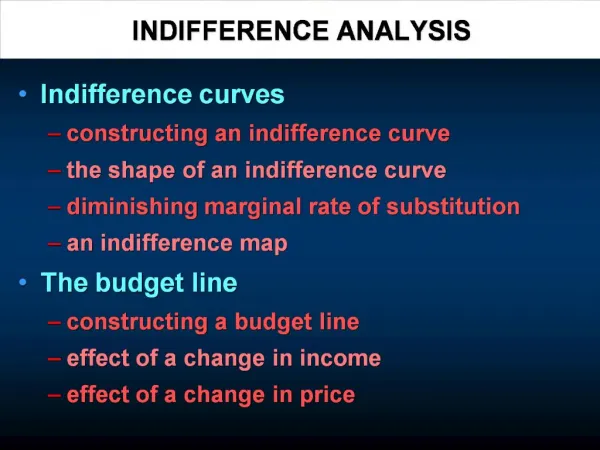
INDIFFERENCE MAP
INDIFFERENCE MAP. Introduction. a diagram consists of a set of indifference curves which shows the ranking of preference We use arrows to show preference direction. Qy. Indifference map is:. U 3. the innermost IC has the highest utility while the outermost has the lowest utility. U 2.


INDIFFERENCE MAP
E N D
Presentation Transcript
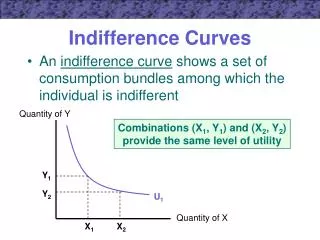
Introduction a diagram consists of a set of indifference curves which shows the ranking of preference We use arrows to show preference direction Qy • Indifference map is: U3 the innermost IC has the highest utility while the outermost has the lowestutility U2 U1 Qx 0 U3>U2>U1
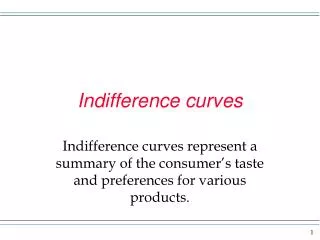
Introduction-(cont’d) • Indifference curves can be used to illustrate a number of economic concepts like perfect substitutes, perfect complements and bads.
Case 1-a good-good situation banana We assume good x to be apple and y to be banana. • Good is something people prefer some to none. Ò the IC farther to the right shows the higher levels of utility as we prefer more of both goods. Ò In this case, the indifference curves are downward sloping and the arrows show preference direction. U3 U2 U1 apple 0 U3>U2>U1
Case 2 -a bad-good situation U3>U2>U1 silence • Opposite to good, bad is something people prefer less to more. • We assume x to be noise pollution (bad) and y to be silence (good). U3 U2 U1 • The arrow points left means a smaller amount of noise will lead to higher utility. • The arrow points up means a greater amount of silence will lead to higher utility ICs are upward sloping 0 Noisepollution
Case 3 -a good-bad situation Noisepollution A case similar to case 2 • we assume x is silence (good) and y is noise pollution (bad) this time • Arrow pointing down means a smaller amount of noise brings higher utility • Arrow pointing right means a greater amount of silence brings higher utility U3>U2>U1 U1 U2 U3 0 ICs are upward sloping silence
Case4 -a bad-bad situation U3>U2>U1 Noise pollution • we assume x is rubbish and y is noise pollution • As they are both bad, this means that we would prefer less of these things • Arrow pointing down means a smaller amount of noise brings higher utility • Arrow pointing left means a smaller amount of rubbish brings higher utility U1 U2 U3 0 ICs are downward sloping and concave to origin rubbish
Case5 -x is good, y is neuter U3>U2>U1 dress in this case, we assume that x is good and y is neuter. To a man ,trousers are good and dresses are neuter. • Neuter is something which a person is indifferent to having, and does not care to have any or none, more or less. For a fixed quantity of trousers,a greater amount of dresses will not affect utility. IC on the right represent a greater quantity of trousers ,so utility is higher . IC are parallel vertical lines and the arrow shows the preference direction U1 U2 U3 0 trousers
Case6 -x is neuter, y is good Similar to case 5 in this case, x is neuter and y is good. The assumption is that for a man, trousers are a good and dresses are a neuter. trousers U3 U2 U1 U3>U2>U1 0 dresses
Case7 -x is bad, y is neuter U3>U2>U1 meat • In this case, we assume that x is bad and y is neuter. Õ To a vegetarian, meat is a neuter as he is indifferent to have any, but the bone of the meat is rubbish and is regarded as bad. Õ The greater quantity of neuter will not affect the level of utility Arrow pointing to the left means a smaller quantity of bad leads to a higher utility U1 U2 U3 0 Bones(bad)
Case8 -x is neuter, y is bad Bones(bad) • Similar to case 7 • In this case, we assume that x is neuter and y is bad. There is still a vegetarian who does not care about having any meat but would not prefer to have any bones as they are waste. • Arrow pointing down means a smaller quantity of bad leads to higher utility U3 U2 U1 U3>U2>U1 0 meat
Case9 -perfect substitutes England’s beef • Perfect substitutes are two goods that can be substitutable at a fixed ratio.(eg. 1:1) 6 M Therefore, MRS is constant, i.e. 1. 5 M If 4 units of England’s beef is exchanged for 4 units of Japan’s beef, utility is constant. 4 M Based on the same MRS, 5 units of England’s beef will be exchanged for 5 units of Japan’s beef, and utility is constant. U3 U2 Japan’sbeef U1 0 4 5 6
Case10 -perfect complements Left sock • Perfect complements are two goods that have to be used together in a fixed proportions. • Here, we will use the left sock and right sock to be our examples. • Compare points A,B,and C • To have 2 left socks and 1 right sock or to have 2 right socks and 1 left sock will not provide a higher utility than 1 left sock and 1 right sock • Similarly , to have 2 left socks and 3 right socks or 3 left socks and 2 right sock will not provide a higher utility than 2 left socks and 2 right socks. 2 U2 B 1 A U1 ICs are L-shaped and the turning point of IC shows the ratio of the two complement goods to be used together C 0 1 2 Right sock