Surface(ground level) ozone
Surface(ground level) ozone. 1.07.2010. http://www.riu.uni-koeln.de/index_e.html.


Surface(ground level) ozone
E N D
Presentation Transcript
http://www.riu.uni-koeln.de/index_e.html he EURopean Air Pollution Dispersion (EURAD) model system simulates the physical, chemical and dynamical processes which control emission, production, transport and deposition of atmospheric trace species. As a result EURAD provides concentrations of these trace species in the troposphere over Europe and their removal from the atmosphere by wet and dry deposition (Hass et al., 1995; Jakobs et al., 1995; Memmesheimer et al., 1997; Kessler et al., 2001). The system consists of three sub-models for the treatment of meteorology (NCAR/Pennstate University; MM5: Mesoscale model, Version 5), chemistry and transport (EURAD-CTM: Chemistry-Transport-Model) and emission (EEM: EURAD Emission Model). It has been applied to the simulation of a large number of air pollution episodes. The majority of cases has been focussing on ozone and other photo-oxidants, yet aerosols and additional pollutants like sulphur and ammonia have also been analyzed. The model system has been applied to the assessment of emission changes as a contribution to the development of strategies for the reduction of air pollution levels in Europe.
Issue 6, March 2010, p.28 NewsLetters of the FP7 EC MEGAPOLI Project “In February 1995 I was a guest at the MPI for Chemistry (MPIC) at Mainz, Germany. My host was Paul Crutzen with whom we published a couple of papers on the global environmental issues. As the Director of Institute (until 2009) I asked Paul’s advice on the study topic in the vast space of Russia. His answer was - surface ozone.” 1970-1971: Crutsen and Johnson revealed the role of nitrogen oxides in the stratospheric catalytic chemistry (NOx = NO + NO2); NO + O3 -> NO2 + O2 NO2 + O -> NO + O2 Net: O3 + O -> O2 + O2 Paul J. Crutzen (Nobel Prize 1985).
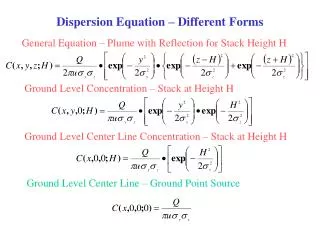
Issue 6, March 2010, p.30 NewsLetters of the FP7 EC MEGAPOLI Project Figure 2 : Modelled O3 concentration for Kiev, 19 Aug 2000, 14:00h. Figure 3 : The comparison of measured (red line) and Calculated(lines 2-4) O3 concentrations for 19-20 Aug 2000 /Lines 2 and 3 -scaled hourly average emissions, line 4 – modulated ones accordingdiurnal traffic motion/.
History of ozone Dutch chemist called Van Marum was probably the first person to detect ozone gas sensorially. In the description of his experiments, he mentioned the notion of a characteristic smell around his electrifier However, the discovery of ozone was only just mentioned by name decennia later, in a writing of Schönbein that dates back to 1840. This discovery was presented to the University of München. Schönbein had noticed the same characteristc smell during his experiments, that Van Marum had tried to identify earlier. He called this gas 'ozone', which is distracted from ozein; the Greek word for scent (to smell). Generally, the discovery of ozone is ascribed to Schönbein. Moreover, Schönbein is mentioned as the first person to research the reaction mechanisms of ozone and organic matter.
"Bad ozone":in photochemical smog -> health threat in the troposphere -> contributes to global warming "Good ozone":in the stratosphere -> absorbs biologically harmful UV radiation emitted by sun. _ Most of the Earth’s atmosphere ozone (about 90%) is found in the stratosphere. Typical ozone concentrations: in very clean troposphere: 10 – 40 ppb; in ozone layer at 25-30 km: about 10 ppm; _ The ozone column abundance is typically specified in Dobson units.
the reaction that produces ozone in the atmosphere(only!): O + O2 + M O3 + M difference between stratospheric and tropospheric ozone generation is in the source of atomic O for solar radiation with a wavelength of less than 242 nm: O2 + hv O + O • little radiation with wavelengths less than ~290 nm makes it down to the troposphere photochemical production of O3 in troposphere tied to NOx (NO + NO2) for wavelengths less than 424 nm: NO2 + hv NO + O but NO will react with O3 NO + O3 NO2 cycling has no net effect on ozone • presence of peroxy radicals, from the oxidation of hydrocarbons, disturbs O3-NO-NO2 cycle • NO + HO2· NO2 + OH· • NO + RO2· NO2 + RO· • leads to net production of ozone
3.1 Химия Городского Смога Измерения в начале 20-го столетия обнаружили, что большая часть атмосферного озона находится в стратосфере. Известно, что озон производится фотодиссоциацией О2 излучением с длиной волны короче, чем 242 нм. Такое коротковолновое излучение имеет место только в стратосфере, а в тропосфереэтот механизм невозможен. После серьезного ущерба урожаю в середине 1940 года, вызванного смогом, исследования позволили обнаружить второй путь для образования озона: NMHC + NO + hv = NO2+ другие продукты , (1) где NMHC - неметановые углеводороды, hv - квант с энергией меньше 410 нм Солнечное излучение диссоциирует NO2 с образованием О: NO2 + hv(<410 нм) = NO + O (2) и рекомбинация О с молекулярным кислородом с образованием озона: O + O2 + M = O3 + M (3) В отсутствие солнечного излучения(ночное время) доминирует обратная реакция NO + O3 = NO2 + O2 (4)
Цикл реакций (2)-(4) не приводит к накоплению озона. Очевидно, что озон будет производиться в том случае, если NO будет конвертироваться в NO2 не посредством О3, а другим путем. Такая возможность была открыта в 1971 году - реакции с участием радикала гидроксила. О3 + hv(<310 нм) = О(1D) + O2 О(1D) + H2O = 2 HO Радикал гидроксила, как известно, реагирует с большим количеством молекул, в том числе - углеводородов: RH + HO = R + H2O, где R - обозначение для любого органического фрагмента, например, С2Н5. R + O2 + M = RO2 + M RO2 + NO = NO2 + RO Последняя реакция, как и (4), окисляет NO с образованием NO2, но без разрушения озона. В результате при достаточном количестве NOx (NO+NO2) иNMHC может резко повышаться содержание озона.
The relative balance of VOCs and NOx at a particular location helps to determine whether the NOx behaves as a net ozone generator or a net ozone inhibitor. When the VOC/ NOx ratio in the ambient air is low (NOx is plentiful relative to VOC), NOx tends to inhibit ozone formation. In such cases, the amount of VOCs tends to limit the amount of ozone formed, and the ozone formation is called "VOC-limited". When the VOC/ NOx ratio is high (VOC is plentiful relative to NOx), NOx tends to generate ozone. In such cases, the amount of NOx tends to limit the amount of ozone formed, and ozone formation is called "NOx -limited". The VOC/ NOx ratio can differ substantially by location and time-of-day within a geographic area. Furthermore, the VOC/ NOx ratio measured near the ground might not represent the ratio that prevails in the air above the ground where most of the tropospheric ozone is generated. the question of how ozone is related to its two main precursors: nitrogen oxides (NOx) and volatile organic compounds (VOC). the predicted reduction in peak O3 resulting from 35% reductions in anthropogenic VOC emissions (crosses) and from 35% reductions in NOx (solid circles) in a series of model scenarios with varying base case emissions, wind fields and mixed layer heights. Results are plotted from tabulated values published in Sillman et al. (1995, 1997).
A high ratio of NOx emissions to VOC emissions usually causes peak ozone concentrations to be higher and minimum concentrations to be lower, compared to background conditions. Peak ozone concentrations are usually highest downwind from urban centers. Light winds carry ozone from urban centers, and photochemical reactions create ozone from urban emissions of VOC and NOx. Also, away from sources of NOx emissions, less NO is available to destroy ozone. Due to the time needed for transport, these peak ozone concentrations in downwind areas tend to occur later in the day compared to peak ozone concentrations in urban areas. Due to the lack of ozone-destroying NO, ozone in rural areas tends to persist at night, rather than declining to the low concentrations (<30 ppb) typical in urban areas and areas downwind of major urban areas, that have plenty of fresh NO emissions. Ratios of peak ozone to average ozone concentrations are typically highest in urban areas and lowest in remote areas (ARB 2002). Within the ground-based inversions that usually persist through the night, ozone concentrations can be very low. In urban areas, emissions of NO near the ground commonly reduce ozone below 30 ppb. In rural areas, however, NO emissions are less prevalent and nighttime ozone may persist well above 30 ppb.
Recent scientific evidence indicates that the current levels of air pollution in European cities are causing significant damage to health, increasing mortality, shortening life expectancy by almost one year, increasing morbidity, and affecting the healthy development of children. [report WHO, EUR/05/5046022) Note that urban ozone is produced from NOx emission by solar UV radiation (<410 nm) in the presence of VOCs(volatile organic compounds), but dependence of ozone concentration on NOx and VOCs concentrations is not linear and the modeling is needed for ozone abatement in each modeling cell of city’s area. The aim of policy-making is to base any regulatory measures on real-time modeling of surface ozone, that estimates the traffic loads and therefore the emissions on each street segment. A Decision Support System (DSS), including observation data management, a geographic information system (GIS), ozone modelling system, and a set of simulation and optimisation models, should be installed centrally and that all the authorities involved in the decision making process should have access to the results provided by the system.
Ozone concentration is enhanced by the addition of terpenes (isoprene, pinene), if the initial NOx level is high or medium, and depleted if the initial NOx is low Oxidation of terpenes by OH and NO3 produces RO2 (alkylperoxy) radicals. RO2 + NO → RO + NO2 NO2 + hν → NO + O O + O2 + M → O3 + M A. H. Goldstein et al., JGRL, 2004, 31, L22106 CH3C(O)OONO2 peroxiacetyl nitrate
Общее содержание озона и тропосферные профили озона над Киевом в 2005-2008 году. Шаврина А.В., Велесь А.А., Павленко Я.В, Шеминова В.А., Синявский И.И., Романюк Я.О. Исследование общего содержания озона над Киевом и изменение его концентраций с высотой в тропосфере (0-12 км) было выполнено на основании наземных наблюдений с инфракрасным Фурье-спектрометром в Главной Астрономической Обсерватории Национальной Академии Наук Украины (ГАО НАНУ) в рамках проекта ESA-NIVR-KNMI no 2907 "OMI validation by ground based remote sensing: ozone columns and atmospheric profiles" (2005-2008 г.г.) Цель проекта – проверка надежности данных мониторинга по общему содержанию озона в атмосфере и атмосферным профилям озона, полученных с инструментом OMI (Ozone Monitoring Instrument) на борту спутника NASA EOS Aura. Метод – сравнение наблюденных спектров полосы озона на 9.6 мкм с модельными. Моделирование спектра было выполнено с помощью программ MODTRAN3(2005), MODTRAN4 и модели молекулярных полос, рассчитанной на основе молекулярной базы данных HITRAN-2004. Выполнено также моделирование поверхностного озона и сделаны оценки риска для здоровья населения г.Киева. Рис.1. Слева - наблюденные в течение дня 23.04.2007 спектры, время наблюдения указано в левом углу. Справа - пример лучшего совмещения модельного спектра с наблюдаемым для 11час. 15 мин.
Рис.: Временные серии (месяц, число, год) значений общего содержания озона по данным спутника Aura-OMI (OMI- TOMS и OMI- DOAS) и наземным наблюдениям с Фурье-спектрометром (FTIR) в 2007 в Киеве (ГАО НАНУ). Табл. Сравнение оценок общего содержанию озона по спутниковым данным OMI TOMS и OMI DOAS и наземным наблюдениям FTIR
Рис. 3. Слева - эпизод весенней стратосферной интрузии 23-28 апреля 2007. Мы видим проникновение стратосферного (18-32 км) озона в тропосферу, его опускание 23-26 апреля и дальнейшую диссипацию и опускание в поверхностный слой 26-28 апреля, когда концентрации поверхностного озона достигли значений, характерных для летних эпизодов, 60ppb. Справа - эпизод фотохимического производства озона в поверхностных слоях загрязненной городской атмосферы 18 июля 2007 года (время указано на нижней шкале, шкала парциальных давлений – hPa, тропосфера - 1000- 215 hPa).
Рис. 4. Сравнение наших восстановленных с помощью моделирования атмосферных профилей озона (зеленая линия) для 23.04.2007 с профилями OMI (OMO3PR, слева –данные OMI 2008 года, справа -2010 года). Шкала содержаний озона выражена в единицах DU для столбцов каждого слоя 18-слоевой атмосферы аналогично данным OMO3PR.
A.V. Shavrina, A.A. VelesMAO of NAS Ukraine V.D. DYACHUK Institute of Hydrometeorology V. Nochvai Pukhov Institute of Modeling Problems in Power Engineering, NAS of Ukraine O.B. BLUM Botanic Garden of NAS Ukraine MODELING OF SURFACE OZONE FOR KIEV CITY Fig.5 : The comparison of measured (bold line) and calculated by UAM-V (Urban Airshed Model)+PMM(3D Prognostic Meteorological Model) O3 concentrations for 19-20 Aug 2000. Lines 2 and 3 -scaled hourly average emissions, line 4 – modulated ones accordingdiurnal traffic motion. Fig.6: Modelled O3 concentration for Kiev, 19 Aug 2000, 14:00h. Fig.7. The map of calculated ozone concentration exceeded 55 ppb (red area) for episode in Kiev on 19 August 2000 during 8 hours (on the left). Fig.8. The local risk levels of surface ozone exposure estimated for the population of the city during modeling episode (on the right).
Влияние приземного озона на состояние системы дыханиянаселения КиеваИ.А. Микульская, С.И. Кифоренко МНУЦ ИТ и С НАНУ и МОНУА.В. Шаврина, В.А. Шеминова ГАО НАН УкраиныО.Б. Блюм Ботанический сад НАН Украины
Recent scientific evidence indicates that the current levels of air pollution in European cities are causing significant damage to health, increasing mortality, shortening life expectancy by almost one year, increasing morbidity, and affecting the healthy development of children. [report WHO, EUR/05/5046022) = Report from a WHO consultative meeting Moscow, Russian Federation, 2005, EUR/05/5046022 Urban air quality management have a goal to reach safe concentrations of atmospheric pollutants throughout the year. Proper air quality management requires an integrated approach consisting of [3]: *Use of air pollution monitoring and modeling to establish an emissions inventory of key pollutants and emissions sources *Use of dispersion modeling to determine the impacts of the emissions on ambient concentrations *Use of dose-response functions and valuation techniques to estimate the impacts of the pollutants on human health *Identification of technically feasible abatement options and calculation of their costs *Estimation of the impacts of these abatement alternatives on ambient air quality and human health *Identification of priority measures with high benefit-cost ratios.
ACKNOWLEDGEMENTS This work was performed in the framework of the International ESA/KNMI/NIVR OMI ``Announcement of Opportunity for Calibration and Validation of the Ozone Monitoring Instrument'', providing early access to provisional OMI data sets and guidance to public OMI data. The team of MAO are very appreciative to the coordinator of the ESA-NIVR-KNMI OMI-AO, Dr. Mark Kroon, for his permanent attention and assistance. We are grateful to the AVDC, Aura-MLS, Aqua-AIRS teams for providing the necessary satellite remote sensing data and TEMIS-KNMI for ozone climatological profiles on websites. This work was supported by the grant of STCU (2005-2007) and by Space Agency of Ukraine (2007-2008). Публикации 1. Shavrina A.V., Pavlenko Ya. V., Veles A. et al. Ozone columns obtained by ground-based remote sensing in Kiev for Aura Ozone Measuring Instrument validation // J. of Geophys. Res.-2007.- 112.- D24S45, doi:10.1029/2007JD008787 2.Шаврина А.В., Павленко Я.В., Велесь А.А. и др. Общее содержание озона в тропосфере и тропосферные профили озона над Киевом в 2007 году.// Космічна наука і технологія, - 2008. - 14.- N 5.- С.85-94 3. Shavrina A.V., Sosonkin M.G., Veles A.A., Nochvaj V. I., Blum O.B., 2008: Integrated modelling of surface and tropospheric ozone for Kiev city. Simulation and Assessment of Chemical Processes in a Multiphase Environm. Barnes I., Kharytonov, M. M. (Eds.), NATO Science for Peace and Security Series C:Environmental Security. Springer, XXV, 345-357. 4. І.О. Микульська, А.В. Шавріна, С.І. Кіфоренко – Забруднення міста Києва приземним озоном як медико-екологічна проблема. Зб. Біомедичніінформаційні технології в охороні здоров’я, м. Київ, БМІТ. – 2008, с. 14-16 5. Final Report on the joint KNMI ESA NIVR OMI Calibration and Validation Announcement of Opportunity, final report 2907 Shavrina, pp. 15-35.M. Kroon (editor) http://www.knmi.nl/omi/research/validation/ao/ 6. Шаврина А.В., Шеминова В.А., Павленко Я.В. и др. Содержание озона над Киевом в 2005-2008 году. Космічна наука і технологія, - 2010(в печати). БЛАГОДАРНОСТИ Авторы благодарны координатору проекта ESA-NIVR-KNMI OMI-AO, д-ру Марку Крону, за его постоянное внимание и помощь, а также администрациям веб-страниц AVDC, Aura-MLS, Aura-TES и Aqua-AIRS за обеспечение необходимых спутниковых данных по зондированию атмосферы. Работа была частично поддержана грантом НТЦУ (2005-2007) и Космическим Агентством Украины (2007-2008). We are very grateful Sharon Douglas and Belle Hudischewskyjfrom SAI (System Application International, USA) for thecodes UAM-V and PPM, their assistance in codes’ installation.


![Level 1 – Flat [Ground]](https://cdn0.slideserve.com/1351041/slide1-dt.jpg)