
Biodiversity in Sacred Groves and Coffee Cultivation in Kodagu, Karnataka, India
E N D
Presentation Transcript
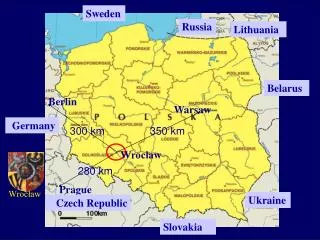
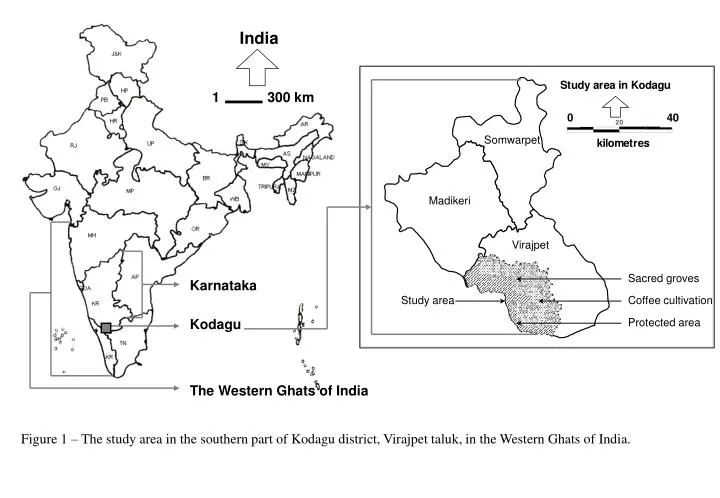
India 1 300 km 0 40 Somwarpet Madikeri Virajpet Sacred groves Karnataka Study area Coffee cultivation Kodagu Protected area Figure 1 – The study area in the southern part of Kodagu district, Virajpet taluk, in the Western Ghats of India. The Western Ghats of India
Figure 2 – Sampling design: A hypothetical sampling locality with a base line running across the patch and the framework of transects placed at random points along the base line, on a randomly chosen side.
28 0 10 29, 48, 49, 50 23 22, 43, 44 Virajpet Kilometres 30, 47 15 21 33 Gonikoppa 56 10 31 55 Ponnampet 9 20 16 19 17, 18, 41, 42 25 3 24, 26, 45 40 13 4, 5 14 39 32 12, 38 27, 46 Legend Srimangala Protected area 34, 35, 57, 58 53, 54 Paddy fields 11, 36, 37 51, 52 7 Sacred groves 1, 2 6 8 Tree-covered land uses including coffee plantations Figure 3 – Landscape map prepared in MapInfo after digitising 42 village land survey maps (scale 1:7920) in one layer. The 58 sampling localities are numbered on the map; 1-10: protected area localities, 11-35: sacred groves, and 36-58 coffee plantations. Sampling localities
For all groups in the diagram Dependent variable Woody Plant Diversity Mean and standard deviation of values of dependent variable Number of observations in a group Percentage frequency distribution of values of independent variable for the group Independent variables Range of values of independent variable for a group of observations Significance value of independent variable Figure 4 – Interpretation of a hypothetical CHAID diagram
Coffee plantations n = 70 Protected area n = 39 Protected area n = 134 Coffee plantations n = 162 10 1 0 5 24 34 19 Protected area n = 97 Coffee plantations n = 86 25 4 96 5 37 14 B 6 A 10 12 20 64 Sacred groves n = 75 11 18 C Sacred groves n = 167 49 Sacred groves n = 142 Figure 5 – Numbers of unique and shared species of (A) trees (≥ 10 cm dbh), (B) birds and (C) mushrooms.