5-Minute Check on Activity 4-6
120 likes | 288 Vues
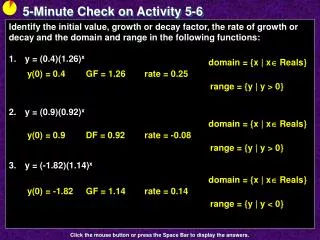
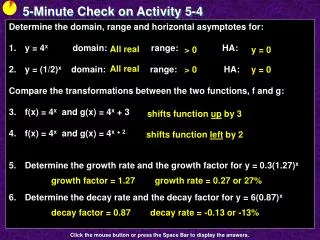
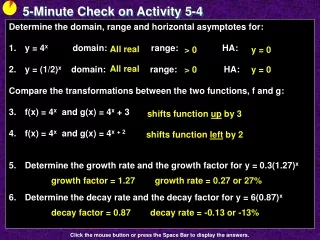
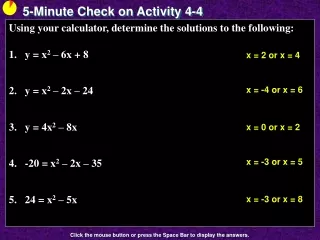
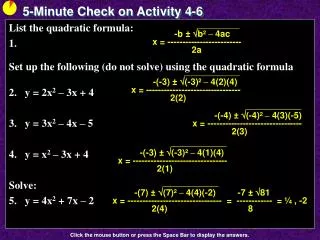
5-Minute Check on Activity 4-6. List the quadratic formula: Set up the following (do not solve) using the quadratic formula y = 2x 2 – 3x + 4 y = 3x 2 – 4x – 5 y = x 2 – 3x + 4 Solve: y = 4x 2 + 7x – 2. -b ± b² – 4ac x = ------------------------- 2a.

5-Minute Check on Activity 4-6
E N D
Presentation Transcript
5-Minute Check on Activity 4-6 List the quadratic formula: Set up the following (do not solve) using the quadratic formula y = 2x2 – 3x + 4 y = 3x2 – 4x – 5 y = x2 – 3x + 4 Solve: y = 4x2 + 7x – 2 -b ± b² – 4ac x = ------------------------- 2a -(-3) ± (-3)² – 4(2)(4) x = -------------------------------- 2(2) -(-4) ± (-4)² – 4(3)(-5) x = -------------------------------- 2(3) -(-3) ± (-3)² – 4(1)(4) x = -------------------------------- 2(1) -(7) ± (7)² – 4(4)(-2) -7 ± 81 x = -------------------------------- = ------------ = ¼ , -2 2(4) 8 Click the mouse button or press the Space Bar to display the answers.
Activity 4 - 7 Air Quality in Atlanta
Objectives • Determine quadratic regression models using the graphing calculator • Solve problems using quadratic regression models
Vocabulary • None new
Activity The Air Quality Index (AQI) measures how polluted the air is by measuring five major pollutants: ground-level ozone, particulate matter, carbon monoxide, sulfur dioxide, and nitrogen oxide. Based on the amount of each pollutant in the air, the AQI assigns a numerical value to air quality, as follows:
D t Activity cont The following table indicates the number of days in which the AQI was greater than 100 in the city of Atlanta, Georgia. Sketch a scatterplot of the data. Let t represent the number of years since 1990 (t in L1 and Days in L2). Therefore, t = 0 corresponds to the year 1990. What does the shape of the graph look like? parabolic or quadratic
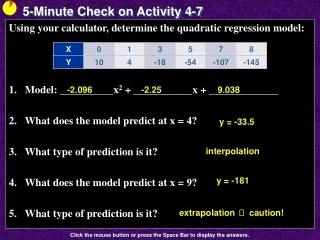
D t Activity cont If the shape was linear, we used LinReg on our calculator to make a model of the data. Our calculator has several other regression models in the STAT, CALC menu. The one that fits parabolas is the QuadReg. What values come out of QuadReg? y = ax2 + bx +c a = 1.75788 b = -13.3236 c = 41.0083 R2 = .98824
Coefficient of Determination The coefficient of determination, R2, describes the percent of variability in y that is explained by the model. Values of R2 vary from 0 to 1. The closer to 1, the better the likelihood of a good fit of the quadratic regression model (equation) to the data.
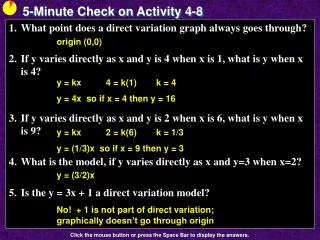
D t Activity cont Use the model, y = 1.75788x2 – 13.3236x + 41.0083, to estimate the number of days the AQI exceeded 100 in Atlanta in each of the following years. What is the “reliability” of the estimates? 34 75 135 1988 and 2002 are extrapolations and of questionable reliability. The 1997 estimate is a interpolation and therefore of better reliability.
D t Activity cont We discovered that the number of days the AQI exceeded 100 in 1997 was 31 and added that to the model, how does the model change now? How does R2 change? Why? Goes down. New value not on curve – adds variability. Before After y = ax2 + bx +c y = ax2 + bx +c a = 1.75788 a = 1.78324 b = -13.3236 b = -13.6353 c = 41.0083 c = 41.2943 R2 = .98824 R2 = .98456
Quadratic Regression Example The following data from the National Health and Nutrition Examination Survey shows the percentage of American adults who are overweight or obese. Let t represent the number of years since 1960 (t in L1 and Days in L2). Therefore, t = 1 corresponds to the year 1961. What is the model? P(x) = 0.017x2 – 0.174x + 45.493
Summary and Homework • Summary • Parabolic data can be modeled by a quadratic regression model • Homework • pg 457 – 461; problems 1 and 2