Download
1 / 30
300 likes | 359 Vues
Learn to identify various cloud types using visible and shortwave IR satellite imagery. Understand how radiation impacts cloud temperatures and interpret cloud characteristics. Enhance meteorological skills with practical examples.

E N D
Clouds on Visible and Shortwave IR - 10 Dr. Wesley Terwey Satellite Meteorology – MET 370 November 2012 Satellite Meteorology – Fall 2012
Cloud Types and Identification • There are a huge variety of cloud types that we may want to identify on satellite imagery. • A good meteorologist can identify most any cloud from two satellite images: visible and shortwave IR (GOES channel 2). • In the following lecture, we will detail the characteristics of each cloud type and show examples of each on both visible and IR. We will use the identification categories described in the prior lecture. Satellite Meteorology – Fall 2012
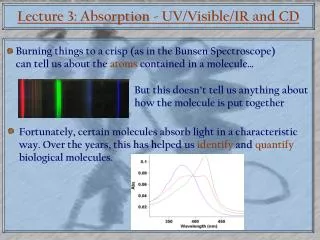
GOES Infrared – 1 • The infrared (IR) sensors detect the intensity of the radiation. Typically, instead of plotting the intensity, the blackbody equivalent temperature of that intensity is plotted. Satellite Meteorology – Fall 2012
GOES Infrared – 2 • Since the satellite is measuring actual intensities, understanding how the radiation got there is important! • Recall all those optical thickness effects in an emitting atmosphere! • Recall atmospheric absorption/emittance for the wavelength! • Recall the role of transmittance and how weighting functions may effect our interpretations of specific images! Satellite Meteorology – Fall 2012
GOES Infrared – 3 • The infrared channels tend to be in window wavelengths. • The water vapor channel is not. Satellite Meteorology – Fall 2012
GOES Infrared – 4 • The general rule of thumb ends up being this: • When looking at IR images, try to use what you see on visible to guess the cloud type. • The temperature you see depends on how optically thick that cloud is. • If the cloud is optically thick, the temperature you see is generally the temperature near the top of the cloud. • If the cloud is optically thin, the temperature you see is a mixture of the surface and cloud temperatures. • This can be useful in estimating WHERE in the atmosphere the cloud is. Satellite Meteorology – Fall 2012
Fog • Fog is made up of large water particles with significant water content, which gives it a moderate reflectivity in the visible. • In IR, the high optical thickness of fog means it radiates its temperature, which is close to the surface temperature given its proximity to the sfc. Satellite Meteorology – Fall 2012
Fog Visible Images - 1 Satellite Meteorology – Fall 2012
Fog Visible – 2 Satellite Meteorology – Fall 2012
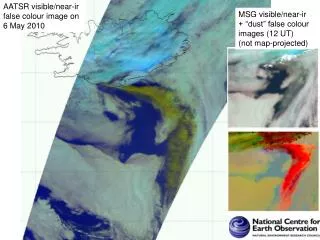
Fog Visible and IR The fog, visible off the Washington coast in the visible, is almost completely invisible in the infrared. There is a slight hint of it, with cooler temperatures, but it is not obvious. Satellite Meteorology – Fall 2012
Stratus • Stratus is made up of medium to large water particles with significant water content, which gives it a moderate reflectivity in the visible. • In IR, the high optical thickness of stratus means it radiates its temperature, which depends on its cloud top height. Satellite Meteorology – Fall 2012
Stratus Visible and IR Relatively “flat” and smooth IR profile Bright and “flat” visible profile Satellite Meteorology – Fall 2012
Stratus IR The stratus deck here over Texas is just a bit “colder” than the surrounding land. This particular stratus cloud was about 1-2 km above the surface. The cloud was truly colder than the surface, which the IR image reflects. Note the smooth color and the mostly distinct edges. Satellite Meteorology – Fall 2012
Stratus Visible - Exception Not all stratus decks are perfectly smooth-looking. Many coastal or cold-water stratus decks border on stratocumulus and will have a mottled appearance at times. As with many weather phenomena, sometimes a feature can be described with a few different names. Satellite Meteorology – Fall 2012
Stratocumulus • Stratocumulus is made up of a variety of droplet sizes and has a medium water content, which gives it a medium to high reflectivity in the visible. • In IR, the high optical thickness of stratocumulus means it appears at its cloud top temperatures. Satellite Meteorology – Fall 2012
Stratocumulus Example – 1 Stratocumulus are very distinctive in the visible imagery and are typical whenever there is a temperature difference between the ocean and ambient air. In the IR, the ragged and mottled appearance is about the only obvious feature. Satellite Meteorology – Fall 2012
Altocumulus • Altocumulus is made up of small to medium water and ice particles with low water content, which gives it a medium to weak reflectivity in the visible. • In IR, the low optical thickness of altocumulus means it lets some surface radiance through, making it look warmer than the cloud tops tend to be. Satellite Meteorology – Fall 2012
Altocumulus Example – 1 Satellite Meteorology – Fall 2012
Altostratus • Altostratus is made up of small to medium water and ice particles with low to medium water content, which gives it a medium reflectivity in the visible. • In IR, the low to medium optical thickness of altostratus means it lets a little of the surface radiance through, making it look slightly warmer. Satellite Meteorology – Fall 2012
Altostratus Example – 1 Since altocumulus and altostratus clouds are very similar looking, they are often grouped together when classifying, especially in satellite applications. Satellite Meteorology – Fall 2012
Cumulus • Cumulus is made up of a variety of droplet sizes and has a medium water content, which gives it a medium to high reflectivity in the visible. • In IR, the high optical thickness of cumulus means it appears at its cloud top temperatures. Satellite Meteorology – Fall 2012
Cumulus Examples – 1 Cumulus clouds can vary from simple fair weather cumulus that occur in quiet conditions to more towering cumulus that occur in more convective situations. Satellite Meteorology – Fall 2012
Cumulus Examples – 2 Satellite Meteorology – Fall 2012
Cumulonimbus • Cumulonimbus is made up of a variety of droplet sizes and has a large water content, which gives it a high reflectivity in the visible. • In IR, the high optical thickness of cumulonimbus means it appears at its cloud top temperatures, which are often cold. Satellite Meteorology – Fall 2012
Cumulonimbus Examples – 1 Cumulonimbus clouds are the big weather makers in the warm months. These clouds are easy to identify, but more and more advances are being made in observing them. Satellite Meteorology – Fall 2012
Cirrus • Cirrus is made up of big ice particles and has a very low water content, which gives it a very light appearance on visible. • In IR, the medium optical thickness of cirrus means it appears at a mixture of surface and cloud top temperatures (which can be very cold). Satellite Meteorology – Fall 2012
Cirrus Examples – 1 Satellite Meteorology – Fall 2012
Cirrocumulus/cirrostratus • Cirrocumulus and cirrostratus are made up of big ice particles and have low water contents, which gives them a light appearance on visible. • In IR, the medium/high optical thickness of cirrocumulus and cirrostratus means it appears mostly at cloud top temperatures. Satellite Meteorology – Fall 2012
CiCu/CiSt Examples – 1 Cirrocumulus and cirrostratus Satellite Meteorology – Fall 2012
Cloud Identification • Practicing cloud identification can aid in many forecasting and nowcasting situations. • Noticing details in these situations will aid in a forecaster’s understanding of an event. Satellite Meteorology – Fall 2012