Download
1 / 19
190 likes | 396 Vues
Grid Enabled Data Fusion for Calculating Poverty Measures. Social Science Applications UK e-Science ALL HANDS MEETING 2006. Background. Social Science Problem. And Policy Issue.

E N D
Grid Enabled Data Fusion for Calculating Poverty Measures Social Science ApplicationsUK e-Science ALL HANDS MEETING 2006
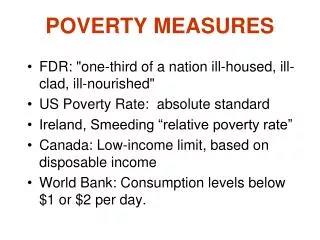
Background Social Science Problem And Policy Issue • Researchers frequently have to use more than one data set in order to obtain a more complete answer to their questions • One data set may provide a large sample of the target population, but offer incomplete coverage of the topics of interest • Another data set with coverage of the topics of interest may not sample the target population adequately What do we know about ethnic minority economic welfare when it is disaggregated by group and geography Census data can lack direct measures of income Survey data yield minority samples that may be too small for meaningful results to be obtained
The statistical analysis involved belongs in the group of data linkage methods. • As there are no identifiable common units in the problem considered here, it is one of statistical data fusion. • The actual methodology used is taken from the poverty mapping literature. • The survey data can be viewed as the donor dataset, with the census based data being the recipient data set.
Data • The British Household Panel Survey (BHPS) provides the small scale survey data. • BHPS is a longitudinal (panel) study with yearly waves. • The Sample of Anonymised Records (SARs) provides the large scale Census data. • SARs are a random sample of individuals and households from the UK Census • Uses 1991 data because of projected confidentiality restrictions on the publicly available version of the 2001 SARs. • 2% sample of individuals, 1% sample of households.
Data Issues • It is time consuming dealing with different data sets when they are available in a wide variety of user unfriendly formats. • Need common and coherent variable definitions for the donor and recipient data sets. Addressed by the Data Grid? • The issues suggest a work practice which becomes messy when dealing with communication between the steps in the overall analysis: data extraction, computation, and results presentation. • This is alleviated by hosting the data on a data grid.
Empirical Analysis • estimate a statistical model using the BHPS data • taking account the heterogeneous nature of the survey data • use the results to provide income predictions for the SARs data • uses parameter estimates from 1. • use the income predictions along with other results to estimate poverty measures and their standard errors. • headcount (% below a given poverty line) • poverty gap (% distance from a poverty line) • present these poverty measures • by UK regions, SARs areas, GB profiled areas • for ethnic groups (by gender if using individuals)
Empirical Issues • Statistical inference may be difficult in combined data problems. Underlying theoretical assumptions may be too strong. Calculation may be difficult. • Simulation techniques may address these difficulties, however, these can be computational intensive. • Here we use a so-called casewise bootstrap:resample from the BHPS data, repeating steps 1 & 2 and SARs sub-sample poverty measure calculation B times.
Addressed by the Computational Grid? • Yes. These techniques are embarrassingly parallel and well suited to implementation on High Performance Computers (HPC). • Scatter the data over P processors, do B/P bootstrap replications per processor, gather the results.
Implementation Issues • Social scientists rarely have easy access to HPC or HTC resources: • Need to avoid deploying complex middleware stacks on end-user's computers. staff, human capital, equipment Suggested the following solution • Tap into established trends & ongoing investments in UK e-Science • National Grid Service (NGS), solves 1. • Web service technologies (portals), solves 2.
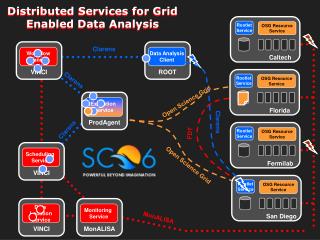
NGS Oracle hosted datasets NGS HPC computing nodes Manchester, Oxford, Leeds, CCLRC RAL BHPS SARs Household SARs Individual GEMEDA parallelized analysis code grid service NGS MyProxy server OGSA-DAI Grid Security Infrastructure DAISGR (DAI Service Group Registry) Globus Toolkit Core Axis Apache Tomcat Athens Server GEMEDA FTP server Apache Tomcat JSP Web interface + Results visualization applet Spring Framework GEMEDA Project Architecture Diagram
Visualization/ Results Presentation • GIS style chloropleth map, • area colouring represents range of poverty measure • with linked plot • boxplot style graphic of income for main category of interest for a chosen area. • Requires mapping data • from EDINA, Athens authenticated • Implemented as a Java applet • uses opensource GeoTools java library 2.
gender buttons area toggle ethnic group buttons
An Empirical Worker's Perspective • What has an e-Research solution provided? • Equipment. • middle range HPCs (and software) are accessible to Social Scientists. • Staff. • maintenance, development and implementation of middleware. • Human capital. • knowledge and experience gained by researchers stays relevant and remains within the Social Science. • No output clutter. • Visualization allows output filtering.
What are the weaknesses of the present implementation? • Sustainability. • staff, maintenance, ... • re-engineering (Globus WSRF, OGSA-DAI & SQL Server, GridSphere, GROWL ...) • Reliability. • error reporting for distributed architecture, documentation • robustness of compute nodes, interoperability of middleware • Security. • Athens authentication, e-certifcates, ... • firewalls, ... • Modeling. • more variables, more data sets, repeat data sets (2001) • interactivity, visualization, ...
Implementation Limitations • Having grid-enabled data does not mean you have the process of data cleaning or data manipulation grid-enabled. • Computational grids require compute resource brokerage (NGS is batch). • Supporting code much larger than business code, specialist elements of the project were easiest to develop.
Other Issues Related to User Engagement • Data disclosure controls. • Confidentiality restrictions. • Proprietorship. • Expertise of researchers within discipline areas. • Technical rather than substantive research agenda
Project Team Simon Peters, Ken ClarkSoSS (economics) Pascal Ekin, Anja Le Blanc, Stephen PicklesManchester Computing Project portal and service: http://pascal.mvc.mcc.ac.uk/gemeda/ Acknowledgements Celia Russell, Mike JonesSAMD Mark Birkin, Andy TurnerHydra I Grid (now MoSeS) Keith ColeConvertGrid Matt FordNGS RES-149-25-0009