Download
1 / 13
130 likes | 408 Vues
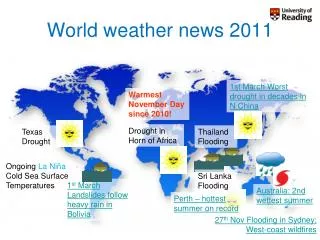
World weather news 2011. 1st March Worst drought in decades in N China. Warmest November Day since 2010!. Drought in Horn of Africa. Texas Drought. Thailand Flooding. Ongoing La Niña Cold Sea Surface Temperatures. Sri Lanka Flooding. 1 st March Landslides follow heavy rain in Bolivia.

E N D
World weather news 2011 1st March Worst drought in decades in N China Warmest November Day since 2010! Drought in Horn of Africa Texas Drought Thailand Flooding Ongoing La Niña Cold Sea Surface Temperatures Sri Lanka Flooding 1st March Landslides follow heavy rain in Bolivia Australia: 2nd wettestsummer Perth – hottest summer on record 27th Nov Flooding in Sydney; West-coast wildfires
World weather news 2111?? More Flooding??? More Droughts???
But how should global precipitation respond to climate change? Hawkins and Sutton (2010) Clim. Dyn.
Physical basis: energy balance Trenberth et al. (2009) BAMS
What rate of rainfall? Net radiative cooling, Ratm≈ 115 Wm-2 Sensible heating of atmosphere, SH ≈ 15 Wm-2 If this balances Latent Heating from precipitation, P: P= Ratm–SH ≈ 100 Wm-2 = 100 J s-1 m-2 Assume density of water, ρw=1000 kgm-3 and latent heating all from condensation, L=2.5x10⁶ J kg-1: Rate of condensation: P/ρwL=100/2.5x109Js-1m-2kg-1m3J-1 kg =4x10⁻⁸ ms-1 =3.4 mm/day A warming atmosphere radiatively cools more effectively…
Global Precipitation is constrained by energy balance Precipitation ~2-3%/K Water vapour ~7%/K Allen and Ingram (2002) Nature
Physical basis: water vapour • Physics: Clausius-Clapeyron • Low-level water vapour concentrations increase with atmospheric warming at about 6-7%/K • Wentz and Shabel (2000) Nature; Raval and Ramanathan (1989) Nature
Large-scale rainfall events fuelled by moisture convergence e.g. Trenberth et al. (2003) BAMS Intensification of rainfall (~7%/K?) Extreme Precipitation
Implications for moisture transport and P-E patternsProjected (top) and estimated (bottom) changes in Precipitation minus Evaporation d(P-E) ≈ Held and Soden (2006) J Climate
The Rich get Richer… Heavy rain follows moisture (~7%/K) Mean Precipitation linked to energy balance (~3%/K) Precipitation Light Precipitation (-?%/K) Temperature
Climate model projections (see IPCC 2007) Precipitation Intensity • Increased Precipitation • More Intense Rainfall • More droughts • Wet regions get wetter, dry regions get drier? • Regional projections?? Dry Days Precipitation Change (%)
References • Allan (2011) Nature470, 344-345 Available at: www.met.reading.ac.uk/~sgs02rpa • Allen and Ingram (2002) Nature419, 224–232 • Held and Soden (2006) J Clim19, 5686–5699 • Trenberth et al. (2003) BAMS84, 1205–1217
Can we use observations to seek/confirm robust responses? Precip. (%) Allan and Soden (2008) Science