001
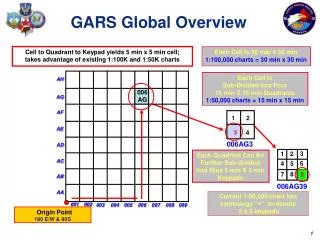
3. 2. 1. Each Cell Is Sub-Divided Into Four 15 min X 15 min Quadrants 1:50,000 charts = 15 min x 15 min. Each Cell Is 30 min x 30 min 1:100,000 charts = 30 min x 30 min. 6. 5. 4. 8. 9. 7. Each Quadrant Can Be Further Sub-divided Into Nine 5 min X 5 min Keypads. 2. 1. 3. 4.

001
E N D
Presentation Transcript
3 2 1 Each Cell Is Sub-Divided Into Four 15 min X 15 min Quadrants 1:50,000 charts= 15 min x 15 min Each Cell Is 30 min x 30 min 1:100,000 charts=30 min x 30 min 6 5 4 8 9 7 Each Quadrant Can Be Further Sub-divided Into Nine 5 min X 5 min Keypads 2 1 3 4 GARS Global Overview Cell to Quadrant to Keypad yields 5 min x 5 min cell; takes advantage of existing 1:100K and 1:50K charts AH 006AG AG AF AE 006AG3 AD AC AB 006AG39 AA Current 1:50,000 chart has symbology “+” to denote 5 x 5 keypads 002 001 003 004 005 006 007 008 009 Origin Point 180 E/W & 90S
N 2 N 8 N 1 N 7 N 3 N 4 N 5 N 6 W 1 E 1 E 2 W 2 W 3 E 3 S 1 S 2 S 3 S 6 S 7 S 8 S 4 S 5