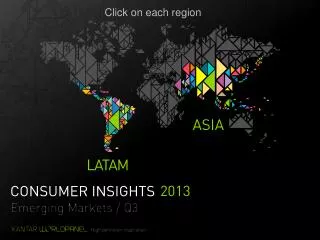
Click on each region
340 likes | 427 Vues
Click on each region. Back to the beginning. MAT Q3 2013 | SUMMARY ASIA. % Value Change FMCG – MAT Q3 2013 vs. Year ago. Back to the beginning. ASIA IN 10 CLICKS Click on each country to display or hide Insights. # GrowthSlowdown Downward market with frequency & price drop.

Click on each region
E N D
Presentation Transcript
Back to the beginning MAT Q3 2013 | SUMMARY ASIA % ValueChange FMCG – MAT Q3 2013 vs. Yearago
Back to the beginning ASIA IN 10 CLICKS Click on each country to display or hide Insights
#GrowthSlowdownDownward market with frequency & price drop. #ShrinkingHighIncomeHigh income group is cutting their spending dramatically. #OnlineOrNearbyOfflineAlong with sustainable online growth, nearby offline channels such as supermarket & CVS & drugstore outgrow hypermarket. #Stabilization FMCGValue growth at 7.1%, first quarter since Q2 2012 not experiencing a slower pace. #TopRetailerSun-Art Group is the only key player to have seen significant growth this quarter reaching a share high of 8.3%. #PopCategoryFunctional drinks keep recruiting shoppers and enlarging basket size. #SlowGDPQ3 GDP performed under par, even previous strong restaurant sector is showing lukewarm performance, possibly affected by the tainted cooking oil incident. #GoodSportSports drink market is seeing light again since the mid-2011 plasticizer debacle, much thanks to the increasing sport population in Taiwan. #Have a cuppaInstant coffee growing steadily, thanks to strong performance from Costco. #HighInflationhas reached almost 7% in the latest month. #FMCG_slowdowncontinues in Q3 2013 driven by Packaged Foods & Personal Care. #Small towns & Rural -earlier the growth engines- have also slowed down in terms of FMCG purchase. #GrowthUncertaintyThough FMCG picks up slightly in recent months thanks to improved economic situation, market growth slow-down hasn’t bottomed out in the long run. #Hyper-SupermarketSlackensGrowth slows to 1-digit for the first time ever as fewer shoppers switch to Hyper-Supermarkets and some even switch back. #EmergingChannels: Minimarkets and Convenience Stores are booming in the current years, reaching 1/5 of urban shoppers. #HomeCleanHomeHousehold care products such as fabcons, bleaches, and scouring pads on an uptrend. Are households giving more importance to home care? #SnackingTimeCookies, wafers and cup cakes aggressively grew versus last year. #Sari-Sari Strong Despite expansion efforts of key retailers, nearly half of FMCG categories are still sourced from traditional trade. #FrequentShoppersUrban Thai households´ Shopping Frequencycontinue to rise with CVS and PVS increasing faster than other channels as Hypermarkets lose share. #BeveragingTheWayBeverage is growing strongly driven by a variety of categories such as RTD Tea, Sterilized Milk, Carbonated Soft Drinks and 100% Juice. #DecliningTrendPure Soluble Coffee and Coffee Creamer continued to witness decline due to switching trend to 3in1. #Slowdown FMCG growth continues to slowdown over the years which is evident across all the sectors and especially dairy and food. #Drivers Even though slowdown was observed across all the SEC'S, it is predominantly driven by affluent class. #Fastest growing category Air Freshner and Condensed Milk are the categories with growing volumes. #DairyIsImportantDairy prices are increasing, but consumers are strong supporter of the dairy sector! #RememberMeShoppers need to be reminded of the yummy peanut butter sandwich! #HealthierRayaDrinks? Not only applies to CSD & Isotonic Drinks during the festive season but seeing more households leaning towards healthier RTD Tea as festive alternative? #InflationSlowsDownIndonesia’s Inflation Slows to 8.4% in September, as pressure eased on prices for food, transportation, communications and financial services after the IdulFitri. #StayAwakeRTD Coffee is the new hero in Beverages market. Growth is increasing significantly in both consumption and buyer base. #ConvenientLifeIndonesian Household is showing interest in Cup Noodle category. The buyer base is doubled versus last year. CHINA SOUTH KOREA INDIA VIETNAM TAIWAN THAILAND SAUDI ARABIA PHILIPPINES MALAYSIA By clicking on the country insights will display. Click again to hide. INDONESIA Details per country: click here
TW VN China ID IN KR MY PH KSA TH Back Homepage Back toSummaryAsia BASKET TRENDS – %Value Change MAT Q3´13 vs. YA MAT Q3.13 MAT Q3.12 MAT Q3.11 %CHANGE FMCG BASKET PER SOCIAL ECONOMIC LEVEL TOP 10 RECRUITERS IN CHINA (by penetrationpointsgrowth) Source: MAT Q313 vs YA CategoryPenetration%
TW VN CN Indonesia IN KR MY PH KSA TH Back Homepage Back toSummaryAsia MAT Q3.13 MAT Q3.12 BASKET TRENDS – %Value Change MAT Q3.13 vs. YA %CHANGE FMCG BASKET PER SOCIAL ECONOMIC LEVEL TOP 10 RECRUITERS IN INDONESIA (by penetrationpointsgrowth) Source: MAT Q313 vs YA CategoryPenetration%
TW VN CN ID India KR MY PH KSA TH Back Homepage Back toSummaryAsia BASKET TRENDS – %ValueChange MAT Q3´13 vs. YA MAT Q3.13 MAT Q3.12 MAT Q3.11 %CHANGE FMCG BASKET PER SOCIAL ECONOMIC LEVEL TOP 10 RECRUITERS IN INDIA (by penetrationpointsgrowth) Source: MAT Q313 vs YA CategoryPenetration%
TW VN CN ID IN MY PH KSA TH South Korea Back Homepage Back toSummaryAsia BASKET TRENDS – %Value Change MAT Q3´13 vs. YA MAT Q3.13 MAT Q3.12 MAT Q3.11 %CHANGE FMCG BASKET PER SOCIAL ECONOMIC LEVEL TOP 10 FMCG BRANDS IN SOUTH KOREA (byconsumerreachpoints) Source: MAT Q313 vs YA CategoryPenetration%
TW VN CN ID IN KR Malaysia PH KSA TH Back Homepage Back toSummaryAsia BASKET TRENDS – %ValueChange MAT Q3´13 vs. YA MAT Q3.13 MAT Q3.12 MAT Q3.11 %CHANGE FMCG BASKET PER SOCIAL ECONOMIC LEVEL TOP 10 RECRUITERS IN MALAYSIA (by penetrationpointsgrowth) Source: MAT Q313 vs YA CategoryPenetration%
Philippines TW VN CN ID IN KR MY KSA TH Back Homepage Back toSummaryAsia BASKET TRENDS – %ValueChange MAT Q3´13 vs. YA MAT Q3.13 MAT Q3.12 MAT Q3.11 %CHANGE FMCG BASKET PER SOCIAL ECONOMIC LEVEL TOP 10 RECRUITERS IN PHILIPPINES (by penetrationpointsgrowth) Source: MAT Q313 vs YA CategoryPenetration%
TW VN CN ID IN KR MY PH TH Kingdom Saudi Arabia Back Homepage Back toSummaryAsia BASKET TRENDS – %Value Change MAT Q3.13 vs. YA MAT Q3.13 MAT Q3.12 MAT Q3.11 %CHANGE FMCG BASKET PER SOCIAL ECONOMIC LEVEL TOP RECRUITERS IN KSA (by penetrationpointsgrowth) Source: MAT Q313 vs YA CategoryPenetration%
TW VN CN ID IN KR MY PH KSA Thailand Back Homepage Back toSummaryAsia BASKET TRENDS – %ValueChange MAT Q3´13 vs. YA MAT Q3.13 MAT Q3.12 MAT Q3.11 %CHANGE FMCG BASKET PER SOCIAL ECONOMIC LEVEL TOP 10 RECRUITERS IN THAILAND (by penetrationpointsgrowth) Source: MAT Q313 vs YA CategoryPenetration%
Taiwan VN CN ID IN KR MY PH KSA TH Back Homepage Back toSummaryAsia BASKET TRENDS – %Value Change MAT Q3´13 vs. YA MAT Q3.13 MAT Q3.12 MAT Q3.11 %CHANGE FMCG BASKET PER SOCIAL ECONOMIC LEVEL TOP 10 FMCG RECRUITERS IN TAIWAN (by penetration point growth) Source: MAT Q313 vs YA Category Penetration%
TW CN ID IN KR MY PH KSA TH Vietnam Back Homepage Back toSummaryAsia BASKET TRENDS – %ValueChange MAT Q3´13 vs. YA URBAN 4 CITIES MAT Q3.13 MAT Q3.12 MAT Q3.11 Note: Data Urban 4 cities TOP 10 RECRUITERS IN VIETNAM (by penetrationpointsgrowth) BASKET TRENDS – %ValueChange MAT Q3´13 vs. YA RURAL Note: Data excludinggift Source: MAT Q313 vs YA CategoryPenetration% - Urban 4 Cities
Back Homepage Back toSummaryAsia ASIA | KEY INDICATORS 2013 Sources: IMF, National Bureau of Statistics of China, Trading economics, India Ministry of statistics & ProgrammeImplementation, Central Statistic Bureau Indonesia, Bank of Korea, Statistics.gov.my, Department of Statistics Malaysia, Bank Negara Malaysia, www.nscb.gov.ph, National Statistical Coordination Board, NESDB, Bank of Thailand, General Statistics Office of Vietnam, Saudi Arabian Monetary Agency, Taiwan Department of Statistics, www.imf.org *Notice that each country FMCG includes all the categories tracked locally, which are not necessarily the same across Asia. In India, limited number of categories reported due to KWP not recording price)
Back Homepage Back toSummaryAsia
Back to the beginning Q3 2013
Back to the beginning Q3 2013 | SUMMARY LATAM (1) Source: IMF – 2013
Back to the beginning • LATAM iN 10 CLIKS • Click on each country to display or hide Insights
MEXICO #SupermarketGoesDownin the last trimester, supermarkets are losing value #TraditionalTradecategories of high rotation are gaining importance in the traditional trade #LessLoyalConsumersin modern trade, specially in warehouses #GlobalSituationAffectswe begin to see some features of the recessive environment in Q3 BOLIVIA #PracticalityIsTrendin clothes care basket and powder soap #Dosage in personal care basket #HealthyJuicesentering to the Bolivian households #GovernmentalMeasures double year bonus announced creating uncertainty in the private sector MÉXICO CENTROAMÉRICA #SlightGrowInCAMBasketmoderate growth in Basket in Central America, where the cluster of Personal Care is not recovered. #BeveragesContributesPositivelyBeverages clustercontributestothebasketgrowth in CAM, influencedmainlybyjuices, nectars and sodas #DairyPositiveContributedairy cluster achieves growth mainly influenced by the category of powder milk VENEZUELA CAM VENEZUELA #AccumulatedInflationAlready in September, theyreachedtheestimatefor 2013 #FewExistancethe shortage of supplies persist in all categories #NewRules The government made official an additional 10% in the minimum wage since November 1st COLOMBIA ECUADOR ECUADOR #PersonalCareGrows4 of 10 categories with the bigger penetration growth are from Personal Care basket, highlighting the recovery of creams, makeup and fragrances. #BasicProductsDevelopmentOils & butters, detergent and powder milk are the fastest growing categories in Volume. #NewBrandsOfSoftDrinkstop brands like soft drinks and juices contract, but a new powder tea brand helps to stabilize the basket #BaseOfThePyramid&ModernTrade Lower SEL and supermarkets are the major contributors to market growth COLOMBIA #SpendingRecoveryWithout further impact, in the short term households reactivate its consumption #HighSELSpendMoreHigh SEL are driving the development of spending without compensating the fall in low and middle SEL households #MoreHouseCleaningBeverages and food are stilllosingspendwhile home careisgainingfrequency #PremiumConsumptionHouseholdspending in migratingtopremiumcategories, generating a loss of basicconsumercategories PERU BOLIVIA BRAZIL BRAZIL #PurchaseFrequencyFallingthe chance of being chosen is dwinling #MediumClassSustainingConsumptionIn 2013 the C class that migrated from D / E continues consuming and driving purchase. #TraditionalTradethe channel that had lower volume and ticket before, now joins the big ones PERU #LowerConsumptionLevelGenerated by less purchase trips #ModernTradeHousewives increasing their purchase frequency in this channel #HighSELare maintaining the basket CHILE #LowerSELdrive the market higher spending from Q3.13 vs Q3.12 #HighSELin thelast 3 years, a decrease in spending and consumptionisnoticed in this SEL households #TraditionalTradeachieves development in recent years, increasing participation in the Chilean market CHILE ARGENTINA #ConsumptionGrowsbut stills being affected by the price increases. #DryFoods&InfusionsGrows even when having the highest price increase. #TopBrandsof each category are driving the basket #ProximityIsTheKeyof the household’s consumption ARGENTINA With 1 click on the country you open the most significant insights, with another click you close them
ARG BRA BOL CAM CHI COL ECU MEX PER VEN Back to Summary Latam Back to the beginning
ARG BRA BOL CAM CHI COL ECU MEX PER VEN Back to Summary Latam Back to the beginning
ARG BRA BOL CAM CHI COL ECU MEX PER VEN Back to Summary Latam Back to the beginning
ARG BRA BOL CAM CHI COL ECU MEX PER VEN Back to Summary Latam Back to the beginning
ARG BRA BOL CAM CHI COL ECU MEX PER VEN Back to Summary Latam Back to the beginning
ARG BRA BOL CAM CHI COL ECU MEX PER VEN Back to Summary Latam Back to the beginning
ARG BRA BOL CAM CHI COL ECU MEX PER VEN Back to Summary Latam Back to the beginning
ARG BRA BOL CAM CHI COL ECU MEX PER VEN Back to Summary Latam Back to the beginning
ARG BRA BOL CAM CHI COL ECU MEX PER VEN Back to Summary Latam Back to the beginning
ARG BRA BOL CAM CHI COL ECU MEX PER VEN Back to Summary Latam Back to the beginning
Back to the beginning Q1 2013 | KEY INDICATORS
Back to the beginning Q1 2013 | KEY INDICATORS
About Kantar Worldpanel Kantar Worldpanel is the world leader in consumer knowledge and insights based on continuous consumer panels. Its High Definition Inspiration™ approach combines market monitoring, advanced analytics and tailored market research solutions to deliver both the big picture and the fine detail that inspire successful actions by its clients. Kantar Worldpanel’s expertise about what people buy or use – and why – has become the market currency for brand owners, retailers, market analysts and government organisations globally. With over 60 years’ experience, a team of 3,500, and services covering more than 55 countries directly or through partners, Kantar Worldpanel delivers High Definition Inspiration™ in fields as diverse as FMCG, impulse products, fashion, baby, telecommunications and entertainment, among many others. For further information, please visit us at www.kantarworldpanel.com.vn Contact us in Vietnam Kantar Worldpanel Vietnam58 Vo Van Tan Street, District 3, Ho Chi Minh City, Vietnamtel: +84 8 39306631fax: +84 8 39306632email: vietnam@kantarworldpanel.comwebsite: www.kantarworldpanel.com.vn KWPVietNam Kantar Worldpanel Vietnam