imaginlabs
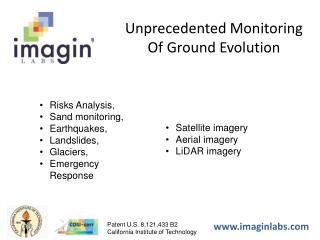
Unprecedented Monitoring Of Ground Evolution. Risks Analysis, Sand monitoring, Earthquakes, Landslides, Glaciers, Emergency Response. Satellite imagery Aerial imagery LiDAR imagery. www.imaginlabs.com. Patent U.S. 8,121,433 B2 California Institute of Technology. Overview.

imaginlabs
E N D
Presentation Transcript
Unprecedented Monitoring Of Ground Evolution • Risks Analysis, • Sand monitoring, • Earthquakes, • Landslides, • Glaciers, • Emergency Response • Satellite imagery • Aerial imagery • LiDAR imagery www.imaginlabs.com Patent U.S. 8,121,433 B2 California Institute of Technology
Overview • Imagin’ Labs Introduction • The COSI-Corr Technology • The COSI-Corr Characteristics • The COSI-Corr Advantages • Case Studies • Further information
Who are we? • Imagin’ Labs was founded around COSI-Corr technology, developed at the California Institute of Technology. • Experts in satellite and aerial image processing. • Experts in surface processes and associated risks (sand-dunes, landslides, glaciers, earthquakes, etc). • Market leaders in ground motion analysis using imagery. • 10 years of experience in satellite imagery and risk analysis. • Clients include: • USGS • NASA • New Zealand GNS
COSI-Corr: Co-registration of Optically Sensed Images and Correlation Multiple Raw imagery acquired at different times Automatic registration with sub-pixel accuracy Automatic comparison Imagin’ Labs COSI-Corr tool suite
The COSI-Corr Characteristics • Registration of satellite and aerial images with sub-pixel accuracy: error ten times smaller than the size of a pixel. • Tracking and monitoring of ground motion, displacement, or changes. • Reconstruction of ground topography using stereo acquisitions. • Ground motion can be retrieved in 3D to characterized underlying process (dune migration, landslide, etc.) • Reconstruction of high-resolution 3D terrain models.
The COSI-Corr Advantages • COSI-Corr allows documenting ground deformation with accuracy on the order of 10 cm using 1 m ground resolution images, or 1/10 of image resolution, • Unique capability, unequalled across the industry, • Sensor agnostic, can use any imagery, even old archives to document long-term landscape evolution (50+ years). • Terrain changes, such as desert sands, are efficiently tracked, • For the oil industry, this reduces the danger that pipelines can rupture if terrain movements occur.
COSI-Corr: Generation of High Fidelity Elevation Models from High Resolution Optical Imagery Depth Map from COSI-Corr Stereo Processing 5 cm GSD images from UltraCAM aerial camera
Cost effectiveness • Imagin’ Labs sub-pixel analysis delivers ground monitoring information of unmatched quality: • For images at a given resolution, Imagin’ Labs delivers more accurate and objective results than would be given by an image analyst. • For a given accuracy, Imagin’ Labs can use lower resolution images, saving data costs and handling by more than a factor of 10! • Automatic analysis: objective and quantitative, no need for large numbers of analysts, no need for extra training. • Can mix processing from different satellites or aerial platforms, so not tight to a single image provider.
Implications for the oil industry • Adoption of the COSI-Corr technology in place of its competitors would yield the following benefits for the oil industry: • Significant savings in oil well construction costs from better siting of wells • Significant savings in pipeline construction costs from improved route mapping • At $Xm per well and $Ym per mile of pipeline, the potential savings are huge
Some Case Studies • Mapping sand risk on Mars for Rover landing and routing, • Rapid mapping ground deformation from earthquake to lead USGS team in the field, • Mapping liquefaction effects in New Zealand to produce zoning maps of reconstruction risks, • Mapping slow landslides motion to monitor risk of failure.
Assessing Sand Dune Risk for NASA Mars Science Laboratory Landing Site High resolution (25 cm) imagery from HiRISE instrument, orbiting Mars on MRO NASA spacecraft. 1 km Sand dunes to be analyzed near landing site to quantify Rover landing risk as indicated by NASA Jet Propulsion Laboratory
Assessing Sand Dune Risk for NASA Mars Science Laboratory Landing Site 1 km From the COSI-Corr analysis, all the dunes were identified as actively migrating Amplitude and orientation of the ripples migration over a 39 months period were quantified Orientation of displacement from the automatic analysis is in accordance with dune morphology and visual interpretation 1 km 1 km 0 cm/yr 85
COSI-Corr used to Quantify Ground Deformation in 3 Dimensions Profile Our unique COSI-Corr technology allows precise mapping of 3D ground motion with accuracy better than the image pixel size. In this example, 50 cm ground resolution WorldView satellite images bracketing a 2010 earthquake in Baja California are analyzed. Ground deformation is retrieved in all X,Y,Z directions with uncertainty better than 10 cm. A linear fence crossing this crack would be split by ~1.5m ~1.5m of slip Profile 1 km 1 km 13
COSI-Corr used to Measure Ground Deformation from LiDAR Using LiDAR to measure ground deformation induced by ground liquefaction in Christchurch, New Zealand 2010-2011. Zoom here next LiDAR: Laser based device measuring ground elevation Study under contract for GNS, New Zealand. 14
COSI-Corr used to Measure Ground Deformation from LiDAR 2010-2011 LiDAR acquisition at 1m. Intensity represents ground elevation. Red arrows point to easily visible areas of extension. 15
Production of large scale maps showing direction and magnitude of ground deformation, as well as strain information. Accuracy better than 10 cm from 1m LiDAR data. Information used to generate risk and city zoning maps (see next slide). Area from previous slide 16
Ground displacement map from which city zoning can be deduced, as seen on the left. 17
COSI-Corr used to Monitor the Risk of Landslides Landslide monitored using 2.5m ground resolution satellite images acquired 9 months apart. 18
Conclusion Adoption of the COSI-Corr technology can yield large saving to the oil and gas industry because: • Better sand risk analyses in desert environments prevent damage to infrastructures, • Objective and independent analyses of pipeline routes mitigate long-terms risks, • Lower cost relative to its competitors saves the industry money.
For Further Information Please Contact: Imagin’ Labs Corporation 530 S Lake Ave, Suite 320 Pasadena, CA 91101 We can help you get the most out of your imagery. • SebastienLeprince, PhD Chief Executive Officer • Sebastien.leprince@imaginlabs.com • Office: +1 (626) 395-2912 • Cell: +1 (626) 240-9041 • Francois Ayoub, MSc Chief Operating Officer • Francois.ayoub@imaginlabs.com • Office: +1 (626) 395-2912 • Cell: +1 (626) 216-4333 www.imaginlabs.com