Understanding the Law of Supply: Principles and Effects on Market Dynamics
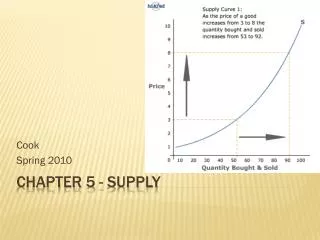
The Law of Supply states that as the price of a good increases, the quantity supplied also increases, reflecting producers' willingness to produce more for larger profits. Conversely, a price decrease leads to a reduction in the quantity supplied. This relationship is illustrated by an upward-sloping supply curve, where each point represents the quantity supplied at a specific price. Various factors, including opportunity costs and producer behavior, drive these changes. The dynamics between supply and demand highlight the complexities of market interactions.


Understanding the Law of Supply: Principles and Effects on Market Dynamics
E N D
Presentation Transcript
1. The Law of Supply • is amount of goods available
1. The Law of Supply • Supply is amount of goods available • the higher the price, the more people produce-they will make more
1. The Law of Supply • Supply is amount of goods available • the higher the price, the more people produce-they will make more money! • -how much of a good is offered for sale at a specific price
1. The Law of Supply • Supply is amount of goods available • the higher the price, the more people produce-they will make more money! • Quantity supplied-how much of a good is offered for sale at a specific price
Supply[withDemand] “Chg in S” [Non-price change] QS is avalueon the X axis and represented by a “movement” caused by a“price change”. “Chg in QS” [Price change] S3 S1 P1 S2 Supply is a “line” and not a point. It is a “schedule” of the amounts producers are “willing and able” to sell. S P P Q3 Q1 Q2 P2 QS QS QS Her husband accidentally hit her while playingThe Legend of Zelda. “Lawof Supply” [P incr, QS incr] [Pdecr, QS decr] Wii “supplied” this black eye.
if price of a good falls, some firms will produce less, why??
if price of a good falls, some firms will produce less, why?? they can’t make as much money • some companies will even enter the market if price is going up
Quantity Supplied vs.Supply Quantity Supplied [QS] is triggered by a price change. QS means quantity of a good/service thatproducers are willing and able to supply at a given time. Supply [S]: A schedule of the total quantities of a good or service thatproducers will supply at different pricesat a given time.Supplyisnot an amountbut abehavior. Supplyis abunch of QS’sstrung together. Price can not cause a change [shift] in “S”. Price can only cause a change [movement] in “QS”.
f. 2 movements that combine to create all of supply • companies changing their level of production • companies entering or leaving the market
g. Higher production • if a company is already making money selling a product, a increase in price will increase companies profits
g. Higher production • if a company is already making money selling a product, a increase in price (Ceteris paribus) will increase companies profits • then company will want to produce more, to make more
g. Higher production • if a company is already making money selling a product, a increase in price (Ceteris paribus) will increase companies profits • then company will want to produce more, to make more money
Consumers & Producers Feel Differently About High & Low prices Producers supply more at the higher price because the opportunity cost increases if they don’t. Consumers consume less at the higher price because they now have less money to spend. Producers supply less at the lower prices because the opportunity cost decreases if they don’t. Consumers consume more at the lower price because they now have more money to spend. I normally eat one, but at this low price, I’m Having two. I’m saving money at the lower price. I was going to buy a Honda but this car is $4,000 cheaper.
example of pizzeria on page 102-if pizzeria was not making profit selling pizza, they would either produce something else, or rise the price of the pizza-if cost of making pizza stayed the same, they would make more profit….if cost of making pizza increases, then they would
example of pizzeria on page 102-if pizzeria was not making profit selling pizza, they would either produce something else, or rise the price of the pizza-if cost of making pizza stayed the same, they would make more profit….if cost of making pizza increases, then they would not make a profit • when price of product goes up, the producer will want to , so they can make more money
example of pizzeria on page 102-if pizzeria was not making profit selling pizza, they would either produce something else, or rise the price of the pizza-if cost of making pizza stayed the same, they would make more profit….if cost of making pizza increases, then they would not make a profit • when price of product goes up, the producer will want to make more, so they can make more money
Law of Supply Change in “QS” 1. Price change 2. Movement (up/down “S” curve) 3. Point to point (along “S” curve) More of you would supply your labor for $12 than if labor were getting just $7.25 an hour. Producers want the highest price possible. Reasons For UpslopingSupply Curve 1. There is increasing opportunity cost if you don’t produce. 2. Current producers produce more [overtime/more shifts] 3. New producers are attracted to the market. . Price increases; QS increases Price decreases; QS decreases “S”refers to the“whole supply curve” and refers to what producers will supply at“different prices”. “QS”refers to a“point on the curve”and refers to what producers will supply at a“particular price”. S P2 P1 QS1 QS2
h. Market entry • other people who notice the profits of a company may try to enter the market • example-page 102-music industry-disco music of the 1970’s new people entered the market to make money of the new disco craze
2. The Supply Schedule • supply schedule shows relationship between
2. The Supply Schedule • supply schedule shows relationship between price and quantity supplied for a specific good • it will show factors that can change-example-price and units supplied • supple schedule lists supply for a very specific set of conditions –all other conditions are assumed to remain
2. The Supply Schedule • supply schedule shows relationship between price and quantity supplied for a specific good • it will show factors that can change-example-price and units supplied • supple schedule lists supply for a very specific set of conditions –all other conditions are assumed to remain constant
d. A change in quantity supplied • word supply is used to refer to the relationship between price and quantity supplied • supply includes all possible combinations of price and output –pg103 • rise or fall in price, will cause quantity supplied to change, but not the supply schedule-a change in a good’s price moves the seller from one row to another in same schedule,
d. A change in quantity supplied • word supply is used to refer to the relationship between price and quantity supplied • supply includes all possible combinations of price and output –pg103 • rise or fall in price, will cause quantity supplied to change, but not the supply schedule-a change in a good’s price moves the seller from one row to another in same schedule, but does not change supply itself • a new schedule has to be made with other than the price changes
e. Market supply schedule • all supply schedules of companies in a market can be added up to create
e. Market supply schedule • all supply schedules of companies in a market can be added up to create market supply schedule • shows relationship between prices and quantity supplied by companies-like in a whole city
e. Market supply schedule • all supply schedules of companies in a market can be added up to create market supply schedule • shows relationship between prices and TOTAL quantity supplied by companies-like in a whole city
e. Market supply schedule • all supply schedules of companies in a market can be added up to create market supply schedule • shows relationship between prices and TOTAL quantity supplied by ALL companies-like in a whole city
f. The Supply Graph • when the data points in supply schedule are graphed-
f. The Supply Graph • when the data points in supply schedule are graphed-supply curve • same as demand curve, except horizontal axis measures quantity of good supplied • supply curve rises from left to right (pg 105)
P QS SUPPLY SCHEDULE and SUPPLY CURVE [“Picture of the Law of Supply”] SUPPLY SCHEDULE SUPPLY CURVE CORN S P $5 $4 $3 $2 $1 $1 2 3 4 5 5 20 35 50 60 QS 5 20 35 50 60
“Let’s make more.” “Take it. We are losing money.” Law of Supply S P2 - As price increases …QS also increases P1 • As pricedecreases • … QS alsodecreases QS1 QS2 S P1 P2 QS1 QS2 DirectrelationshipbetweenP&QS
Supply (and Demand) “Bread & Butter” of Economics[“perfectly competitive markets”] Butter Bread Law of Supply– QSvariesdirectlywithprice. Suppliers offer more for sale athigher prices than at lower prices. The consumers, being on the paying end, tend to buy a small amount of the product, but will buy more if the price is lowered. The supplier, on the receiving end, considersprice as anincentive to sell a product. The higher the price, the more incentive he has.
Change in “Supply” [Curve] 1. “Non-price change” [RATNEST] 2. Whole supply curve “shifts” [There was a QS change but it was not caused by a change in price] I have just 200 acres. "RATNEST" . Corn Alternative Output Price Change [INVERSE] Broccoli S1 S S2 P2 P1 P “Substitutes in production” “Things that can be supplied with the same resources.” QS1 QS2 S1S2 P “Supply Shifters” [RATNEST] 1.Resource Cost [wages /raw materials ] [INVERSE] 2. Alternative Output Prices [INVERSE] 3. Technology [DIRECT] 4. Number of Suppliers [DIRECT] 5. Expectations [about future price] [INVERSE] 6. Subsidies [DIRECT] 7. Taxes [INVERSE] [capital cost] [new football league- bigger “S” of games] S1 S3 S2 Don’t confuse these two with Chg in QS. P “Suppliers produce smaller/ larger quantities at each price.” QS1 QS3 QS2
g. Supply and Elasticity • elasticity of supply is measure of the way suppliers respond to change in price • (changes greater than 1) (chance is less than 1) and (exactly equal to 1)
g. Supply and Elasticity • elasticity of supply is measure of the way suppliers respond to change in price • elastic(changes greater than 1) (chance is less than 1) and (exactly equal to 1)
g. Supply and Elasticity • elasticity of supply is measure of the way suppliers respond to change in price • elastic(changes greater than 1) inelastic (chance is less than 1) and (exactly equal to 1)
g. Supply and Elasticity • elasticity of supply is measure of the way suppliers respond to change in price • elastic(changes greater than 1) inelastic (chance is less than 1) and unitary (exactly equal to 1)
Elastic/Inelastic Supply Curves Quantity Supplied Think of “responsiveness” as “flatness”. Quantity Supplied
3. Elasticity of Supply and Time • Time determines the elasticity • in short run, if a company cannot easily changes its output level, the supply is
3. Elasticity of Supply and Time • Time determines the elasticity • in short run, if a company cannot easily changes its output level, the supply is inelastic • in long run, firms are more flexible, so supply is
3. Elasticity of Supply and Time • Time determines the elasticity • in short run, if a company cannot easily changes its output level, the supply is inelastic • in long run, firms are more flexible, so supply is elastic
d. Short Run • Orange grove is example-got to grow trees to produce oranges-pg105-cannot grow more trees too fast, but in short run maybe use more effective pesticide-inelastic • also new producers will
d. Short Run • Orange grove is example-got to grow trees to produce oranges-pg105-cannot grow more trees too fast, but in short run maybe use more effective pesticide-inelastic • also new producers will not enter into the market • short run, inelastic, regardless if price changes • other business can me more changing, and more elastic in short run-business that supply services
e. long run • supply can be more elastic over time-grow more orange trees • supply becomes more elastic over time
4. Cost of Production a. Labor and Output • how many workers to
4. Cost of Production a. Labor and Output • how many workers to hire effects production • Marginal Product of Labor-
4. Cost of Production a. Labor and Output • how many workers to hire effects production • Marginal Product of Labor-change in output from hiring more workers • measures in the change in output at the margin, where the last worker has been hired or fired (1 worker produced 4 units, a second one total output is 10-so the marginal product of labor is 6)
Increasing Marginal Returns-more workers means each one can specialize-increasing returns • Diminishing Marginal Returns-too many workers causes the output to