Download
1 / 60
600 likes | 605 Vues
MHP is a quasi-public agency working to increase the supply of affordable housing in Massachusetts and collaborating with municipalities to find innovative solutions. They offer permanent financing, research on housing data, and various resources.

E N D
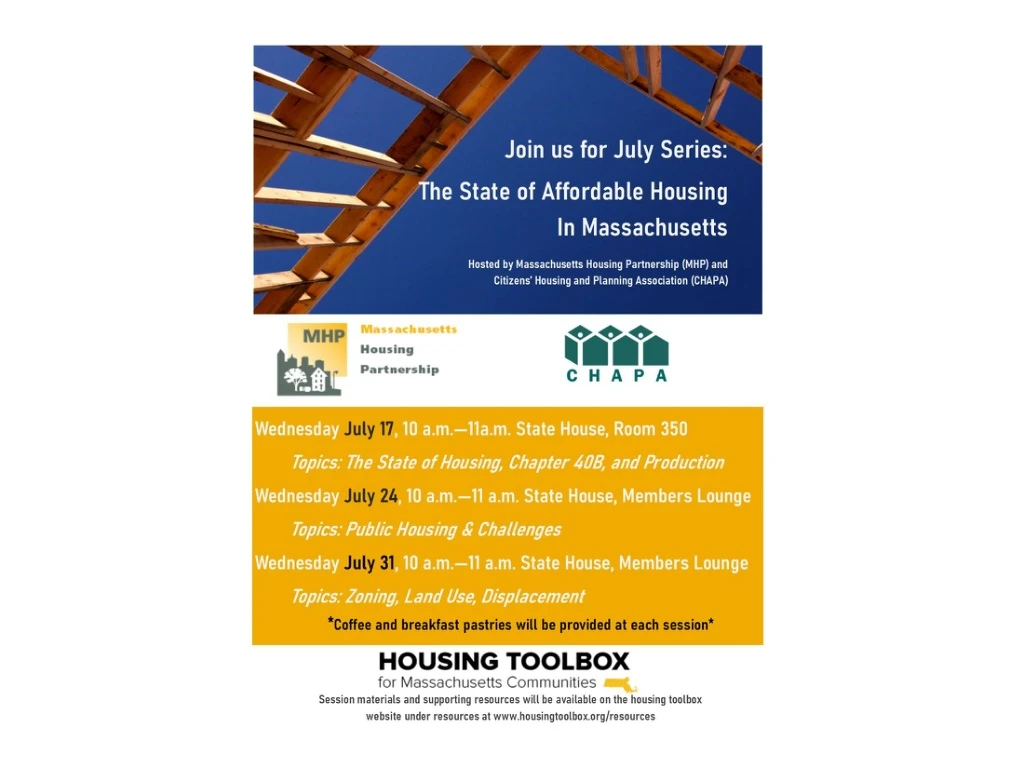
Who we are Massachusetts Housing Partnership (MHP) is a quasi-public agency created by state statute in 1985 • Increase the supply of affordable housing in the state • Work with municipalities to demonstrate new and better ways of meeting our affordable housing needs
What we do • Community Assistance team • Permanent financing for affordable rental housing • ONE Mortgage program • Research on housing data to support policy efforts
351 zoning jurisdictionsin Massachusetts Massachusetts cities and towns that are equivalent in population to a single zoning jurisdiction in Fairfax County, VA In metropolitan Washington, DC, for example, the Fairfax County Board of Supervisors makes land use decisions for nearly a million Virginia residents. In Massachusetts, permitting decisions for that same metro area population would be made by 38 cities and towns serving a median of less than 17,000 residents each.
Transforming Tysons, VA “By 2050, Tysons will be transformed into a walkable, sustainable, urban center that will be home to up to 100,000 residents and 200,000 jobs. Tysons is envisioned to become a 24-hour urban center where people live, work and play; where people are engaged with their surroundings; and, where people want to be.” Circa 1935 Proposed
www.housingtoolbox.org • Assessing needs • Local tools (NEW) • Local support • Zoning and land use • Fair housing • Housing development process • Financing and funding • Case studies & best practices (NEW) • Resources
Planning for Affordability What’s Zoning Got to Do With It?
What can we learn from other states? Report from California / San Francisco area
“affordable” vs. “Affordable” Built with local, state or federal funds, or uses these funds to operate. Has restrictions on maximum incomes, and maximum rents. Only people earning less than a certain max income can qualify to live there. Naturally occurring affordability; i.e. “Woah I can’t believe what a good deal this apartment is!” Anyone can live there, as long as you make it past the landlord’s checks.
How zoning and resulting land uses effect cost FAR, IZ, housing type (single, multi) lot size requirements, set backs, etc. Existing 1300 sf home 8,000 sf lot $550,000 (upgrades needed) but no tear down Tear down site 5,500 sf home 8,700 sf lot $2,000,000 Cannot build two family as of right Historic town center area Multi-family, small lots, larger buildings, single family; variety, moderate land use.
Are we building for the future or the past? Greater Boston average lot size: What’s Different? Demographics: aging population, living longer, smaller family sizes, increasing diversity, more transient Preferences: increasing preference for walkable communities, decrease car dependency, limit environmental impact, conscious of resiliency needs Work: where we work, how we work, job opportunities; loss of middle income jobs, growth in low and high income (access) Technology: everything!
Massachusetts Zoning and other Land Use Regulations Our zoning is old M.G.L. Chapter 40A- “The Zoning Act,” was enacted in 1975 Replaced Previous Act of 1954, and 1918 975 • Our water & sewer regulations are old, many based on 1978 assumptions such as: • The decrease in family size • The use of water conserving fixtures and plumbing, for example a washing machine in 1978 used 40-50 gallons per load, today as little as 17 gallons
MASSACHUSETTS HOUSING CHALLENGES; MULTI-FACETED AND SOLVABLE (but not easy) HOUSING SOLUTIONS ARE NEED AND ENVIRONMENT SPECIFIC Expensive urban jobs, access, fun, displacement Struggling urban poor transit, secondary job markets, lower incomes, prohibitive rehab due to state building codes Expensive rural second homes Struggling rural aging population, weak economy, struggling public schools, no broad band Expensive suburban high ranking public schools, vibrant town centers Struggling suburban Sprawl, little or no transit, limited local services, weak local economy INFRASTRUCTURE: THE FOUNDATION UPON WHICH WE THRIVE (OR NOT) a.k.a. PUBLIC INVESTMENT
Exclusionary Zoningthrough the lens of Fair Housing Shelly GoehringSenior Program Manager
1884 Arlington, MA
1938Arlington, MA Home Owners’ Loan Corporation
Arlington district C-2Why is it “declining?” • Area Characteristics • Detrimental Influences: “Obsolescence. Business and housing mixed together. Railroad tracks through neighborhood.” • Trend of desirability next 10-15 years = DOWN • Inhabitants • Occupation: clerks –labor • Estimated annual family income: $1,500-2,500 • Foreign-born families: Italian • Infiltration of: Lower class • Clarifying RemarksLittle possibility of conversion of properties to business use.
Arlington’s First Zoning Map - 1924 Yet Arlington remained largely “pro-growth.” 1945 – district to allow four stories or 60’ height(10+ more created, largely in NE & 7 blocks along Pleasant) Von Hoffman, Alexander. “Creating an Anti-Growth Regulatory Regime: A Case from Greater Boston.” Joint Center for Housing Studies, Harvard University. Feb. 2006.
Arlington Single Family Attached HomesSunnyside Avenue, Two-Family zoning district Built in 1948 andsold for $6,250 $6,250 = $65,366 in today’s dollars Source: Town of Arlington,Bureau of Labor Statistics
2015 Arlington, MA Zoning Map
Conservation and Historic Movements 1960s and 1970s • 1966 – Arlington Conservation Commission Enabled by state legislation – protect and develop the town’s natural resources, conduct research, draw plans and recommend actions • 1970 – Arlington Historical Commission Purpose to preserve & protect historic buildings, discourage demolition, advise town building inspector Von Hoffman, Alexander. “Creating an Anti-Growth Regulatory Regime: A Case from Greater Boston.” Joint Center for Housing Studies, Harvard University. Feb. 2006.
Arlington created a Redevelopment Board • 1970s as “anti-growth” movement grew • Reversed town’s “pro-growth” policy • Two-year moratorium on multifamily development (154-17 TM vote) • New zoning in 1975 – ↑ lot size, ↓ height, ↑ parking, ↑ zoning districts “Residents should be the ultimate decision makers about how the area they live in should be developed.” Von Hoffman, Alexander. “Creating an Anti-Growth Regulatory Regime: A Case from Greater Boston.” Joint Center for Housing Studies, Harvard University. Feb. 2006.
2015 Arlington, MA Zoning Map
Many only develop in Arlington once. --long-time Arlington real estate lawyer
Weston, MA • ~15 miles from downtown Boston • Three commuter rail stops -- Fitchburg line • Access to 90, 95 and Routes 20, 30 and 117 • Almost 1/5 of land is public forests, conservation land or parks • Much of the private land is woods, meadows and lawns • No public sewer
Hastings Organ Factory Built on farm fields in the Hastings family since the early 19th century. Near the railroad and Stony Brook.
Resident Leadership Changed • 1820sSummer residents and gentlemen farmers move in. By late 1880s, began separating from others. • 1890+Began suppressing industry to protect scenery. • 1954New zoning designed to curb growth by increasing lot size. Remaining developable land put in Residential Class A (minimum 60,000 square feet).Second growth control measure, increased buying conservation land. • 1955-75Adds 1,300 acres of open space to the 50 acres owned in 1945.Almost 12% of Weston’s total area. www.westonhistory.org and “To Preserve and Protect: Land Use Regulations in Weston, MA” by Alexander von Hoffman.
Weston Minimum lot sizes Dark Green = 20,000 square ft(0.46 acre) Bright Green = 30,000 square ft(0.69 acre) Light Green = 40,000 square ft(0.91 acre) White = 60,000 square feet(1.37 acres)
Weston Compared to Neighbors Boston 14,387
By 2010 in Massachusetts 2010 Census
Exclusionary Zoning Use of zoning ordinances to exclude certain types of land uses from a given community. What it looks like: • Large minimum lot sizes • Only one home per lot • Low income housing only in currently low income (or less affluent) neighborhoods
Large lot zoning drives up costs. Greater Bostonmedianlot size: Greater Bostonaverage lot size:
These unlawful practices include zoning laws and other housing restrictions that function unfairly to exclude minorities from certain neighborhoods without any sufficient justification. Suits targeting such practices reside at the heartland of disparate-impact liability. --Justice Kennedy, Texas Department of Housing and Community Affairs v. Inclusive Communities Project, Inc. (5-4 decision)
“Class” is not a protected class under the Fair Housing Act Federal (Fair Housing Act) • Race • Color • National Origin • Religion • Sex • Familial Status • Disability State (M.G.L. c. 151B) All federal bases plus: • Ancestry • Age • Marital Status • Source of Income/Public Assistance • Sexual Orientation • Gender Identity • Veteran History/ Military Status • Genetic Information
But class has racial implications.
Racial Wealth Gap Homeownership contributes 27% to racial wealth gap (Single biggest share) Difference in income contributes 20% to racial wealth gap Brandeis Institute on Assets & Social Policy, “The Roots of the Widening Racial Wealth Gap: Explaining the Black-White Economic Divide,” 2013.
Massachusetts HomeownershipRacial gap = 49thin nation www.scorecard.prosperitynow.org/2016
The Consequences are REAL • Takes 8 more years for A-A household to buy • Lower incomes and less inheritance • Slower to accumulate equity • More wealth in home • 53% Black vs 39% White • Greater impact from housing market volatility Brandeis Institute on Assets & Social Policy, “The Roots of the Widening Racial Wealth Gap: Explaining the Black-White Economic Divide,” 2013.
A Look at Net Worth Brandeis Institute on Assets & Social Policy, “The Roots of the Widening Racial Wealth Gap: Explaining the Black-White Economic Divide,” 2013.