Download
1 / 17
230 likes | 992 Vues
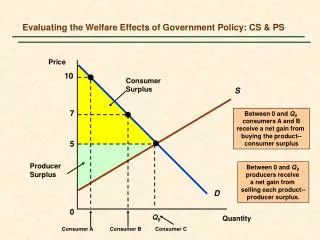
10. Consumer Surplus. S. 7. Between 0 and Q 0 consumers A and B receive a net gain from buying the product-- consumer surplus. 5. Producer Surplus. Between 0 and Q 0 producers receive a net gain from selling each product-- producer surplus. D. Q 0. Consumer A. Consumer B.

E N D
10 Consumer Surplus S 7 Between 0 and Q0 consumers A and B receive a net gain from buying the product-- consumer surplus 5 Producer Surplus Between 0 and Q0 producers receive a net gain from selling each product-- producer surplus. D Q0 Consumer A Consumer B Consumer C Evaluating the Welfare Effects of Government Policy: CS & PS Price 0 Quantity
Suppose the government imposes a price ceiling Pmax which is below the market-clearing price P0. S Deadweight Loss The gain to consumers is the difference between the rectangle A and the triangle B. B P0 C A The loss to producers is the sum of rectangle A and triangle C. Triangle B and C together measure the deadweight loss. Pmax D Q1 Q0 Q2 Price Ceilings and the Welfare Loss Price Quantity Chapter 9
If demand is sufficiently inelastic, triangle B can be larger than rectangle A and the consumer suffers a net loss from price controls. D B S P0 C Example Oil price controls and gasoline shortages in 1979 A Pmax Q1 Q2 Price Ceiling: Demand Is Inelastic Price Quantity Chapter 9
D S The gain to consumers is rectangle A minus triangle B, and the loss to producers is rectangle A plus triangle C. 2.40 B 2.00 A C (Pmax)1.00 18 Price Controls and Natural Gas Shortages Price ($/mcf) Quantity (Tcf) 0 5 10 15 20 25 30 Chapter 9
When price is regulated to be no lower than P2 only Q3 will be demanded. The deadweight loss is given by triangles B and C S P2 A B P0 C What would the deadweight loss be if QS = Q2? D Q3 Q0 Q2 Price Floors and the Welfare Loss Price Quantity Chapter 9
Firms are not allowed to pay less than wmin. This results in unemployment. S wmin A B The deadweight loss is given by triangles B and C. w0 C Unemployment D L1 L0 L2 Price Floor: The Minimum Wage w L Chapter 9
Prior to deregulation price was at Pminand QD = Q1 and Qs = Q3. S Area D is the cost of unsold output. Pmin A B P0 After deregulation: Prices fell to PO. The change in consumer surplus is A + B. C D D Q1 Q3 Q0 Q2 Price Floors: Airline Deregulation Price Quantity Chapter 9
Qg D + Qg Agricultural Price Floors: Price Supports and Production Quotas The cost to the government is the speckled rectangle Ps(Q2-Q1) Price S To maintain a price Ps, the government buys quantity Qg . The change in CS = -A – B; the change in PS = A + B + D. Total welfare loss is D-(Q2-Q1)ps Ps A B D P0 Total Welfare Loss D Quantity Q1 Q0 Q2 Chapter 9
Supply restricted to Q1 • Supply shifts to S’ @ Q1 • Ps is maintained with production • quota and/or financial incentive • Cost to government = B + C + D S’ S PS A B D P0 • CS reduced by A + B • Change in PS = A - C • Deadweight loss = BC C D Q1 Q0 Price Floors: Supply Restrictions Price Quantity Chapter 9
The increase in price can be achieved by a quota or a tariff A = the gain to domestic producers The loss to consumers = A + B + C + D If a tariff is used the government gains D, so the net domestic product loss is B + C. If a quota is used instead, D becomes part of the profits of foreign producers, and the net domestic loss is B + C + D. S P* B D C A Pw D QS Q’S Q’D QD Import Tariff or Quota: General Case Price Quantity Chapter 9
DUS SUS PUS = 21.9 B D C The cost of the quotas to consumers was A + B + C + D, or $2.4b. The gain to producers was area A, or $1b. A PW = 11 Qd = 24.2 QS = 4.0 Q’S = 15.6 Q’d = 21.1 US Sugar Quota in 1997 D = the gain to foreign firms with quota rights = $600m B and C = the DWL = $800 m. Price (cents/lb.) 20 16 11 8 4 0 5 10 15 20 25 30 Quantity (billions of pounds)
Pb is the price (including the tax) paid by buyers. PSis the price sellers receive, net of the tax. The burden of the tax is split evenly. S Pb Buyers lose A + B, and sellers lose D + C, and the government earns A + D in revenue. The deadweight loss is B + C. B A P0 D C t PS D Q1 Q0 Incidence of a Specific Tax Price Quantity Chapter 9
Incidence of a Specific Tax • Conditions that must be satisfied after the tax is in place: 1) Quantity sold and Pb must be on the demand line: QD = QD(Pb) 2) Quantity sold and PS must be on the supply line: QS = QS(PS) 3) QD = QS 4) Pb - PS = tax Chapter 9
D S Pb S t Pb P0 P0 PS t D PS Q1 Q0 Q1 Q0 Impact of a Tax Depends on Es & Ed Burden on Buyer Burden on Seller Price Price Quantity Quantity
D S Lost Consumer Surplus Pb = 1.22 A P0 = 1.00 D t = 0.50 Lost Producer Surplus PS = .72 11 60 89 100 Impact of a 50 Cent Gasoline Tax Deadweight loss = $2.75 billion/yr Price ($ per gallon) 1.50 The annual revenue from the tax is .50(89) or $44.5 billion. The buyer pays 22 cents of the tax, and the producer pays 28 cents. .50 Quantity (billion gallons per year) 0 50 150 Chapter 9
S Like a tax, the benefit of a subsidy is split between buyers and sellers, depending upon the elasticities of supply and demand. PS s P0 Pb D Q0 Q1 Effect of a Subsidy Price Quantity Chapter 9
The Efficiency of a Competitive Market: Any Market Failure? 1) Externalities: Costs or benefits that are not reflected in the market price (e.g. pollution) 2) Lack of Information: Imperfect information prevents consumers from making utility-maximizing decisions. • Government intervention in these markets can increase efficiency. • Government intervention without market failure creates inefficiency or DWL. Chapter 9


![FISCAL POLICY [“G” and “T”]](https://cdn3.slideserve.com/5787261/fiscal-policy-g-and-t-dt.jpg)