Glitches in the Vela Pulsar
10 likes | 242 Vues
Glitches in the Vela Pulsar. Sarah Buchner 1,3 , Claire Flanagan 1 , 2 1 Hartebeesthoek Radio Astronomy Observatory 2 Johannesburg Planetarium 3 School of Physics, University of the Witwatersrand. The Vela pulsar (J0835-4510) has been observed almost daily from HartRAO since 1984.

Glitches in the Vela Pulsar
E N D
Presentation Transcript
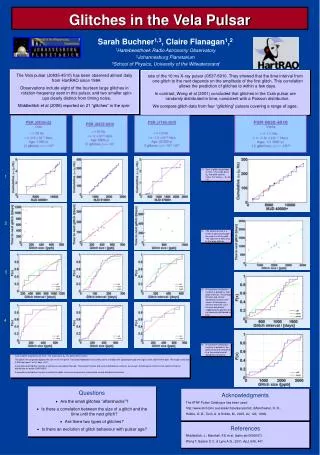
Glitches in the Vela Pulsar Sarah Buchner1,3, Claire Flanagan1,2 1Hartebeesthoek Radio Astronomy Observatory 2Johannesburg Planetarium 3School of Physics, University of the Witwatersrand The Vela pulsar (J0835-4510) has been observed almost daily from HartRAO since 1984. Observations include eight of the fourteen large glitches in rotation frequency seen in this pulsar, and two smaller spin-ups clearly distinct from timing noise. Middleditch et al (2006) reported on 21 “glitches” in the spin- rate of the 16 ms X-ray pulsar J0537-6910. They showed that the time interval from one glitch to the next depends on the amplitude of the first glitch. This correlation allows the prediction of glitches to within a few days. In contrast, Wong et al (2001) concluded that glitches in the Crab pulsar are randomly distributed in time, consistent with a Poisson distribution. We compare glitch data from four “glitching” pulsars covering a range of ages. • Sum of glitch magnitudes vs time – the slope gives Ag- the glitch activity index. For Vela Ag~ 8 Hz / yr. 1 2 • The dotted red line is a linear fit (passing through the origin) to all the data. The cyan line is fitted only to the large glitches. 3 • A cumulative distribution function is plotted for inter-glitch intervals. Theoretical Poisson and normal distribution functions are shown. A Kolmogorov-Smirnov test rules out a Poisson distribution, suggesting the glitches are not randomly distributed in time. 4 • A cumulative distribution function is plotted for the glitch sizes and compared to a theoretical normal distribution functions. • Sum of glitch magnitudes vs time – the slope gives Ag- the glitch activity index. • The glitch interval plotted against the size of the first glitch. Following Middleditch et al (2006) we fit a straight line (passing through the origin) to the J0537-6910 data. The slope of this line is 399 days ppm-1 or 6.4 days Hz-1. • A cumulative distribution function is plotted for inter-glitch intervals. Theoretical Poisson and normal distribution functions are shown. A Kolmogorov-Smirnov test rejects a Poisson distribution for pulsar J0537-6910. • A cumulative distribution function is plotted for glitch sizes and compared to a theoretical normal distribution functions. • Questions • Are the small glitches “aftershocks”? • Is there a correlation between the size of a glitch and the time until the next glitch? • Are there two types of glitches? • Is there an evolution of glitch behaviour with pulsar age? Acknowledgments The ATNF Pulsar Catalogue has been used: http://www.atnf.csiro.au/research/pulsar/psrcat/, (Manchester, R. N., Hobbs, G. B., Teoh, A. & Hobbs, M., 2005, AJ, 129, 1993). References Middleditch, J.; Marshall, F.E et al, (astro-ph/0605007) Wong T, Backer D.C. & Lyne A.G., 2001, ApJ, 548, 447