Download
1 / 8
80 likes | 191 Vues
This comprehensive analysis offers a value creation framework aimed at refining operations by focusing on key factors such as gross margin optimization, scheduling, logistics, and energy intensity. It highlights opportunities for improvement in unit yields, quality management, and material loss reduction while advocating for mechanical reliability and effective outsourcing strategies. By identifying inefficiencies through activity-based analysis, this framework seeks to enable refineries to optimize costs, enhance profitability, and achieve significant returns on gross investments.

E N D
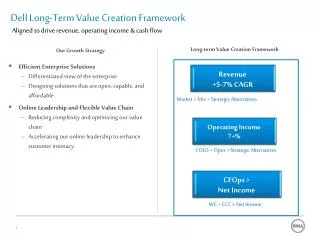
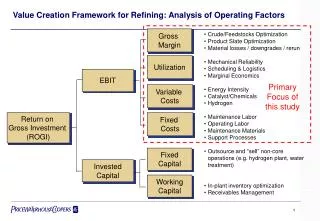
Value Creation Framework for Refining: Analysis of Operating Factors Gross Margin • Crude/Feedstocks Optimization • Product Slate Optimization • Material losses / downgrades / rerun • Mechanical Reliability • Scheduling & Logistics • Marginal Economics • Energy Intensity • Catalyst/Chemicals • Hydrogen • Maintenance Labor • Operating Labor • Maintenance Materials • Support Processes • Outsource and “sell” non-core operations (e.g. hydrogen plant, water treatment) • In-plant inventory optimization • Receivables Management Utilization EBIT Primary Focus of this study Variable Costs Return on Gross Investment (ROGI) Fixed Costs Fixed Capital Invested Capital Working Capital
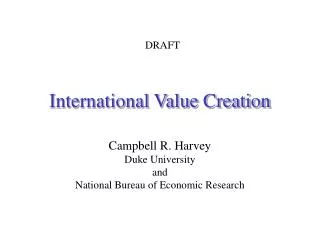
A Comprehensive Review will be Required to Achieve $1 per barrel ILLUSTRATIVE Improvement Opportunities Impact On Results Improvement Target, $/B + 0.30 - 0.10 + 0.40 - 0.20 + 0.60 - 0.40 + 1.00 • Improve unit yields • Improve quality management and consistency • Reduce material losses • Use more marginal capacity • Increase bitumen content of oil sands • Improve energy efficiency • Improve purchasing of catalyst and chemicals • Reorganize operations to improve productivity • Improve maintenance planning; reduce dead inventory • Outsource non-core support services • Increase quality-tracking automation (lab+on-stream analyzers) + Product Value Feedstock Cost Gross Margin Variable Cost Variable margin Fixed Costs Net Margin - = - = - =
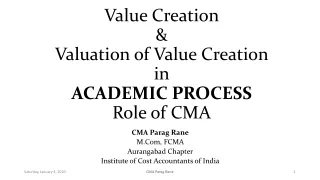
An Activity-Based Analysis is Required to Uncover Inefficiencies... The Traditional View ILLUSTRATIVE Activity-Based View Typical cost profile for a large, complex refiner
… and plan the operations better in the future Move from managing resources to managing activities Activity-Based View The Traditional View Payroll-Normal 30 20 50 Payroll-Overtime 12 8 20 Equip./Mat’ls 3 7 10 Contractors 4 1 5 Total 49 36 85 Preparation 5 3 8 Repair 6 15 21 Testing 14 15 29 Return to Service 24 3 27 Total 49 36 85 Unit Turnaround: Resources Unit Turnaround : Activities Oper. Maint. Total Oper. Maint. Total . . . lacks relevant information about the work being performed and why it is being performed. . . . is actionable, easily understood and can be related to resources and products.
1.70 1.65 1.60 1.55 1.50 Fixed Operating Costs, $/B 1.45 2.7 1.40 2.6 1.35 2.5 1.30 1.25 2.4 Cash Operating Costs, $/B 1.20 1994 1996 1998 2.3 1.2 2.2 1.1 2.1 1.0 2.0 1994 1996 1998 Variable Operating Costs, $/B 0.9 0.8 0.7 0.6 1994 1996 1998 Refiners have made progress on reducing costs... Fixed Operating Costs Cash Operating Costs Study Group Pacesetter Variable Operating Costs Source: Client analysis of Solomon Benchmarks
97.0 96.5 96.0 Mechanical Availability, % 95.5 95.0 94.5 94.0 1994 1996 1998 95.0 90.0 85.0 Energy Intensity Index 80.0 75.0 70.0 1994 1996 1998 …and efficiencies have improved as well Mechanical Availability Refinery Personnel 5.5 Study Group 5.0 4.5 FTE Personnel per M BPD 4.0 Pacesetter Energy Intensity 3.5 3.0 1994 1996 1998 Source: Client analysis of Solomon Benchmarks
Cost Minimization is Not the Answer:Increasing Value in Refining Operations Requires Cost Optimization Gross Margin Crude Costs • Increased deterioration in yields / efficiencies • Increased unit breakdowns / outages • Decrease turnaround costs • Decrease routine maintenance costs Net Margin Gross Product Value Variable Costs Fixed Costs Utilization Routine Maintenance HSE Performance MAINTENANCE Systemic Analysis and Modeling can help find optimum cost levels • Increased quality excursions (off-spec) • Increased unit instability; lowered throughputs • Increased risk of HSE incidents • Decrease staffing / payroll costs Cash Profit Optimal target range OPERATIONS Cost of Activity
Benchmarking is a good starting point, but insight is required to drive improvements • On Pacesetter refineries: “Somehow, this group appears to employ a superior combination of facilities, raw materials, products, and operating expenses relative to most other refineries.” • “The Pacesettersdo not have the best energy efficiency, the lowest manpower, the lowest maintenance costs, or the highest yield as final goals.” They encourage their people to... [achieve] optimum utilization of all resources to generate the best profitability available to the plant.” • “The Pacesetters appear to be constantly reviewing their competitive status, questioning their own practices, and transforming themselves.” From Solomon Fuels Study; Pacesetter defined as refinery consistently performing at 1st Quartile level, based on ROI