Download
1 / 9
90 likes | 290 Vues
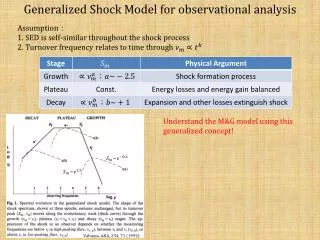
Generalized Shock Model for observational analysis. Assumption : 1. SED is self-similar throughout the shock process 2. Turnover frequency relates to time through. Understand the M&G model using this generalized concept!. Valtaoja, A&A, 254, 71 (1992).

E N D
Generalized Shock Model for observational analysis Assumption: 1. SED is self-similar throughout the shock process 2. Turnover frequency relates to time through Understand the M&G model using this generalized concept! Valtaoja, A&A, 254, 71 (1992)
Generalized Shock Model in light curve behavior For , they reach the peak of the light curve at the same time. The higher the frequency, the lower the flux level. For, they peak when . The peak flux doesn’t change much with frequency. Valtaoja, A&A, 254, 71 (1992) For , they peak when . The peak flux decays with frequency and depends on how the shock dissipates. *Note that this only holds true iff the shock dissipation is slower than power law index 2.5. (b<2.5) Peak time scales with freq.
Generalized Shock Model in light curve analysis For , they reach the peak of the light curve at the same time. The higher the frequency, the lower the flux level. For , they peak when . The peak flux doesn’t change much with frequency. For , they peak when . The peak flux decays with frequency and depends on how the shock dissipates. *Note that this only holds true iff the shock dissipation is slower than power law index 2.5. (b<2.5) Peak time scales with freq.
Example:PKS 1510-089 Flux level rising: Flux level at max: Flux level falling: Orienti, MNRAS, 428, 2418 (2013)
Example:PKS 1510-089 Orienti, MNRAS, 428, 2418 (2013) Valtaoja, A&A, 254, 71 (1992) Valtaoja, A&A, 254, 71 (1992) Orienti, MNRAS, 428, 2418 (2013)
Example:3C279 Flux level falling: Flux level at max: Flux level rising: Larionov, A&A, 492, 389 (2008)
Example:3C279 –self similarity of SED Valtaoja, A&A, 254, 71 (1992) Larionov, A&A, 492, 389 (2008)
Counter (?) Examples Hovatta, A&A, 485, 51 (2008) Valtaoja, ApJS, 120, 95 (1999) Plateau Stage in the generalized shock model seems to be missing??
Where is the Plateau Stage ??? What happened ? Hovatta+ 2008 discusses a population of 55AGNs with multiple flares … so this doesn’t look like a lone phenomena… However, this isn’t explained YET!As we have seen in the cases of PKS1510-089 and 3C 279, the plateau stage seems to be there… Valtaoja, A&A, 254, 71 (1992) Hovatta, A&A, 485, 51 (2008) There seems to be no explanation to this YET???? (one more thesis topic )