Download
1 / 36
360 likes | 480 Vues
This presentation by Robert A. Houze Jr. from the University of Washington examines the variability and intensity of mesoscale convective systems (MCSs) globally, utilizing data from TRMM and CloudSat radars. It highlights the relationship between extreme weather events, including devastating floods in Pakistan between 2010 and 2012, and MCS characteristics such as deep convective cores and broad stratiform regions. The study also discusses the importance of MCSs in rainfall dynamics and their behavior influenced by factors like topography and the Madden-Julian Oscillation.

E N D
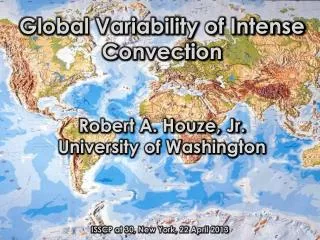
Global Variability of Intense Convection Robert A. Houze, Jr. University of Washington ISSCP at 30, New York, 22 April 2013
Radars in Space CloudSat 2006- TRMM 1997-
TRMM data showing storms producing the floods 2010 2011 2012 30N Sindh 25N 65E 75E 65E 75E 65E 75E 16 Height (km) 8 0 0 287 0 232 0 241 Distance (km)
These storms are • Mesoscale Convective Systems • “MCSs”
Large areas of cold top Example outbreak of MCSs
Radar echoes showing the precipitation in the 3 MCSs StratiformPrecipitation ConvectivePrecipitation 1458GMT 13 May 2004
TRMM and CloudSat radars & other data have helped us map MCS occurrence globally
TRMM Radar Distinguishes Convective and Stratiform Components of MCSs Identify each contiguous 3D echo objectseen on radar Convective component Stratiform component Extreme characteristic Contiguous 3D volume ofconvective echo > 40 dBZ Extreme characteristic Contiguous stratiform echowith horizontal area > 50 000 km2 “Broad stratiform region” Horizontal area >1 000 km2 “Wide convective core” Top height > 10 km “Deep convective core”
JJAS DJF Deep Convective Cores • South Asia&SouthAmerica Wide Convective Cores BroadStratiformRegions
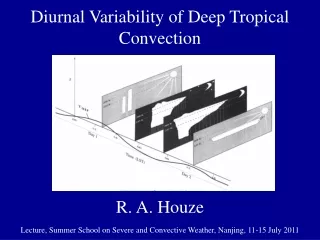
Deep Convective Cores Wide Convective Cores • Africa BroadStratiformRegions
TRMM Radar Observations of the MJO over the Indian Ocean Active Phase Suppressed Phase Deep Convective Cores Broad Stratiform Rain Areas Phase 7
Basic components Cold top Convective Stratiform Anvil Anvil Houze et al. 1989 Raining core A-Train sees all of this!
The Anvil Problem Mesoscale Convective System Need to understand how anvil is related to the raining region Extensively studied
Statistics of anvil width & thickness seen by CloudSat Africa Indian Ocean Yuan and Houze 2010
Internal structure of MCS anvils Africa Indian Ocean Yuan, Houze, and Heymsfield 2011
Identify High Cloud Systems (HCSs) Heavy rain Rain 260K Closedcontour Separated HCS Connected HCSs
Which HCSs are MCSs? Yuan and Houze 2010
PDF of rain amount as a function of raining core properties Min TB11 over raining core 220°K Using these values for “MCS” criteria 56% all tropical rain 2000 km2 Yuan and Houze 2010 Size of raining core
MCSs Over the Whole Tropics Smallest 25% (<12,000 km2) Largest 25% (>40,000 km2) “Superclusters” Yuan and Houze 2010
Indian Ocean MCSs Contribution to Rainfall by phase of the Madden-Julian Oscillation Active Suppressed Connected MCSs Separated MCSs Other high cloud systems Yuan and Houze 2012
Composite MCS Lightning Eq. Africa Argentina West Pacific Eq. Atlantic Connected Separated • Determined from WWLLN
Composite MCS Lightning in the MJO Separated ACTIVE Separated SUPPRESSED
Conclusions • TRMM radar data: • Deep convection takes on various forms • Forms controlled bymountain ranges & flow regimes such as the MJO & monsoon • A-Train data • Show anvils of MCSs • Identifies MCSs globally • Lightning data related to MCSs, e. g. in MJO • To come: relate to aerosol observations
End This research was supported by NASA grant NNX10AH70G, NASA grant NNX10AM28G, and NSF grant AGS-1144105
Internal structure of MCS anvils CVCV CVCV Indian Ocean Anvils
Cold top Anvil Anvil Raining core MODIS/AMSR-E identifies cold top locates the raining core remainder is anvil
Frequency of MCS anvils over tropics Yuan and Houze 2010